Web performance is a crucial factor in determining the success of any website. Slow-loading pages, unresponsive interfaces, and other performance issues can significantly impact user experience, leading to decreased engagement, higher bounce rates, and lost revenue.
To start taking back control over your web performance, you need to monitor it using the appropriate metrics. TTI, which stands for Time To Interactive, is one such metric that tells you how long it takes for your page to be fully interactive for your users.
What is Time To Interactive (TTI)?
Time To Interactive (TTI) is a performance metric used to evaluate how long it takes for a page to become fully interactive to the user.
The interactivity of a page is measured by four criteria:
- The browser displays meaningful content,
- The page is ready to handle actions for visible elements that the user can initiate,
- The page responds to user interactions within 50 milliseconds, and
- The most significant scripts in your page’s code have been executed, leaving the main thread idle.
It’s vital to understand that TTI doesn’t just measure the load time of your page; it goes beyond that. TTI focuses on interactivity.
Load time vs. interactivity – what is the difference?
Load time and interactivity are different but related aspects of web performance. Load time describes the time it takes to load a website’s content. In contrast, interactivity describes the time it takes for a website to become responsive.
It may sound like comparing two synonyms, but the difference is quite vital.
Imagine getting up early on Monday morning. You woke up with the alarm, yawned, and there was nothing more to load before starting your day. It doesn’t mean, however, that you’re ready for the call from your boss. You’re going to need some coffee to become fully responsive.
TTI is a user-centric metric focused on assessing web performance from the practical perspective of your potential customer.
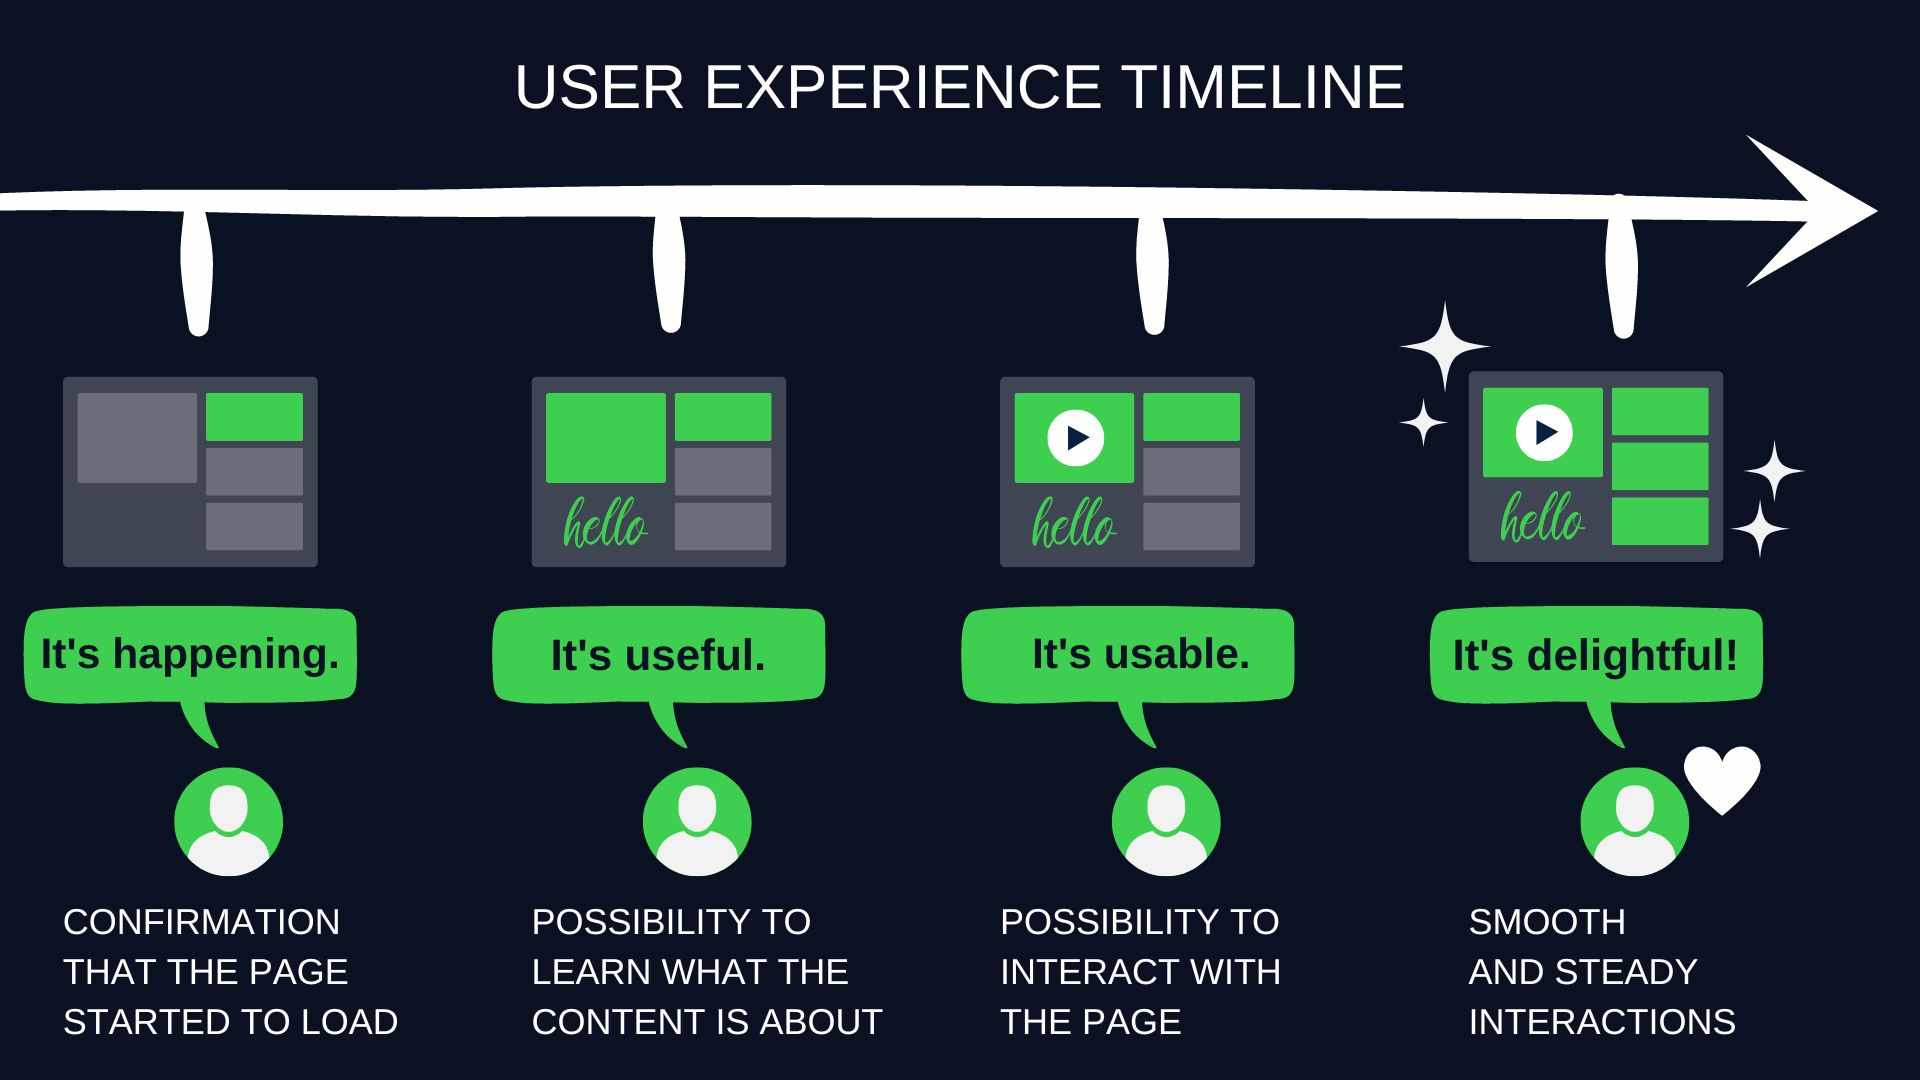
To keep users on a website, four essential moments must happen in quick succession during page loading.
- Firstly, the user receives a visible signal that the page is loading.
- Secondly, the loaded content becomes useful enough to understand the page’s content.
- In the third step, the page becomes interactive.
- Finally, the page is fully interactive, meaning that user interactions can occur smoothly and without interruptions.
You can think of TTI as a way to check how long it takes your website to provide users with a truly satisfying experience in terms of perceived speed. By controlling that time, you can lower your bounce rate and leave a good impression on your users.
Is TTI a Core Web Vitals Metric?
The short answer is no. Core Web Vitals are a set of three metrics that measure different aspects of user experience. Largest Contentful Paint measures perceived load speed, First Input Delay measures responsiveness, and Cumulative Layout Shift measures visual stability. These three metrics are considered essential for evaluating a website’s user experience.
Other web vital metrics aren’t considered “core” but provide additional information about your website’s speed.
TTI may not be a candidate Core Web Vitals metric and may not impact your rankings on Google. But it’s still worthwhile to use this metric. A good TTI score can lead to a lower CLS, and TTI remains a relevant measure of how users perceive your website early in the visit.
How is Time to Interactive calculated?
TTI is measured in seconds, and calculating it for your page requires identifying the First Contentful Paint and a first 5-second quiet window. In this window, the browser should not process any tasks on the main thread that take more than 50 milliseconds and should not wait for more than two server response requests.
TTI is a point in time between FCP and the quiet window which occurs just as the final long task before the quiet window is completed.
I know that it may seem complicated, so let me explain it in simpler terms. I’ll start by defining what FCP is and then show you how your page loads using a timeline visualization.
Defining the beginning of your TTI search scope
Calculating the TTI score starts with defining your FCP.
First Contentful Paint is a metric that designates the first point in the page load timeline when the user can view anything on the screen. A swift FCP helps to give the user a sense that the page is loading properly.
It’s important not to confuse FCP with LCP (Largest Contentful Paint). LCP is a performance metric that determines when the largest element on a web page becomes visible in the user’s browser.
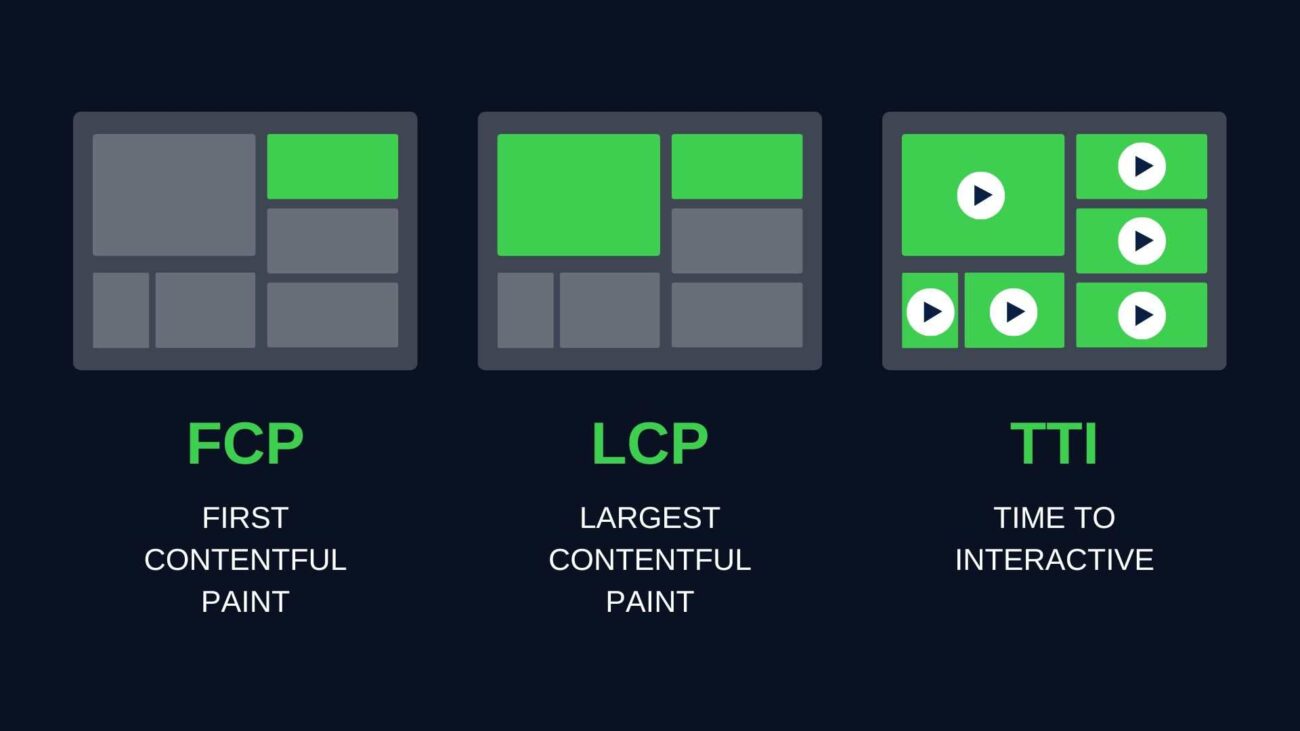
LCP is always ready before your page is fully interactive, but it doesn’t affect the calculation of the TTI metric.
Defining the end of your TTI search scope
Imagine the timeline of your page’s loading process. The user browser executes many scripts. Some of those tasks take longer than 50 milliseconds and are relevant for measuring TTI. The browser also asynchronously sends resource requests to your server, and each of the requests stays “open” until it gets its response.
There is a moment when the browser can take a break that we call a “quiet window.” It’s the first time that, for at least five seconds, it doesn’t have to perform any long task on the main thread, and it has no more than 2 resource requests open.
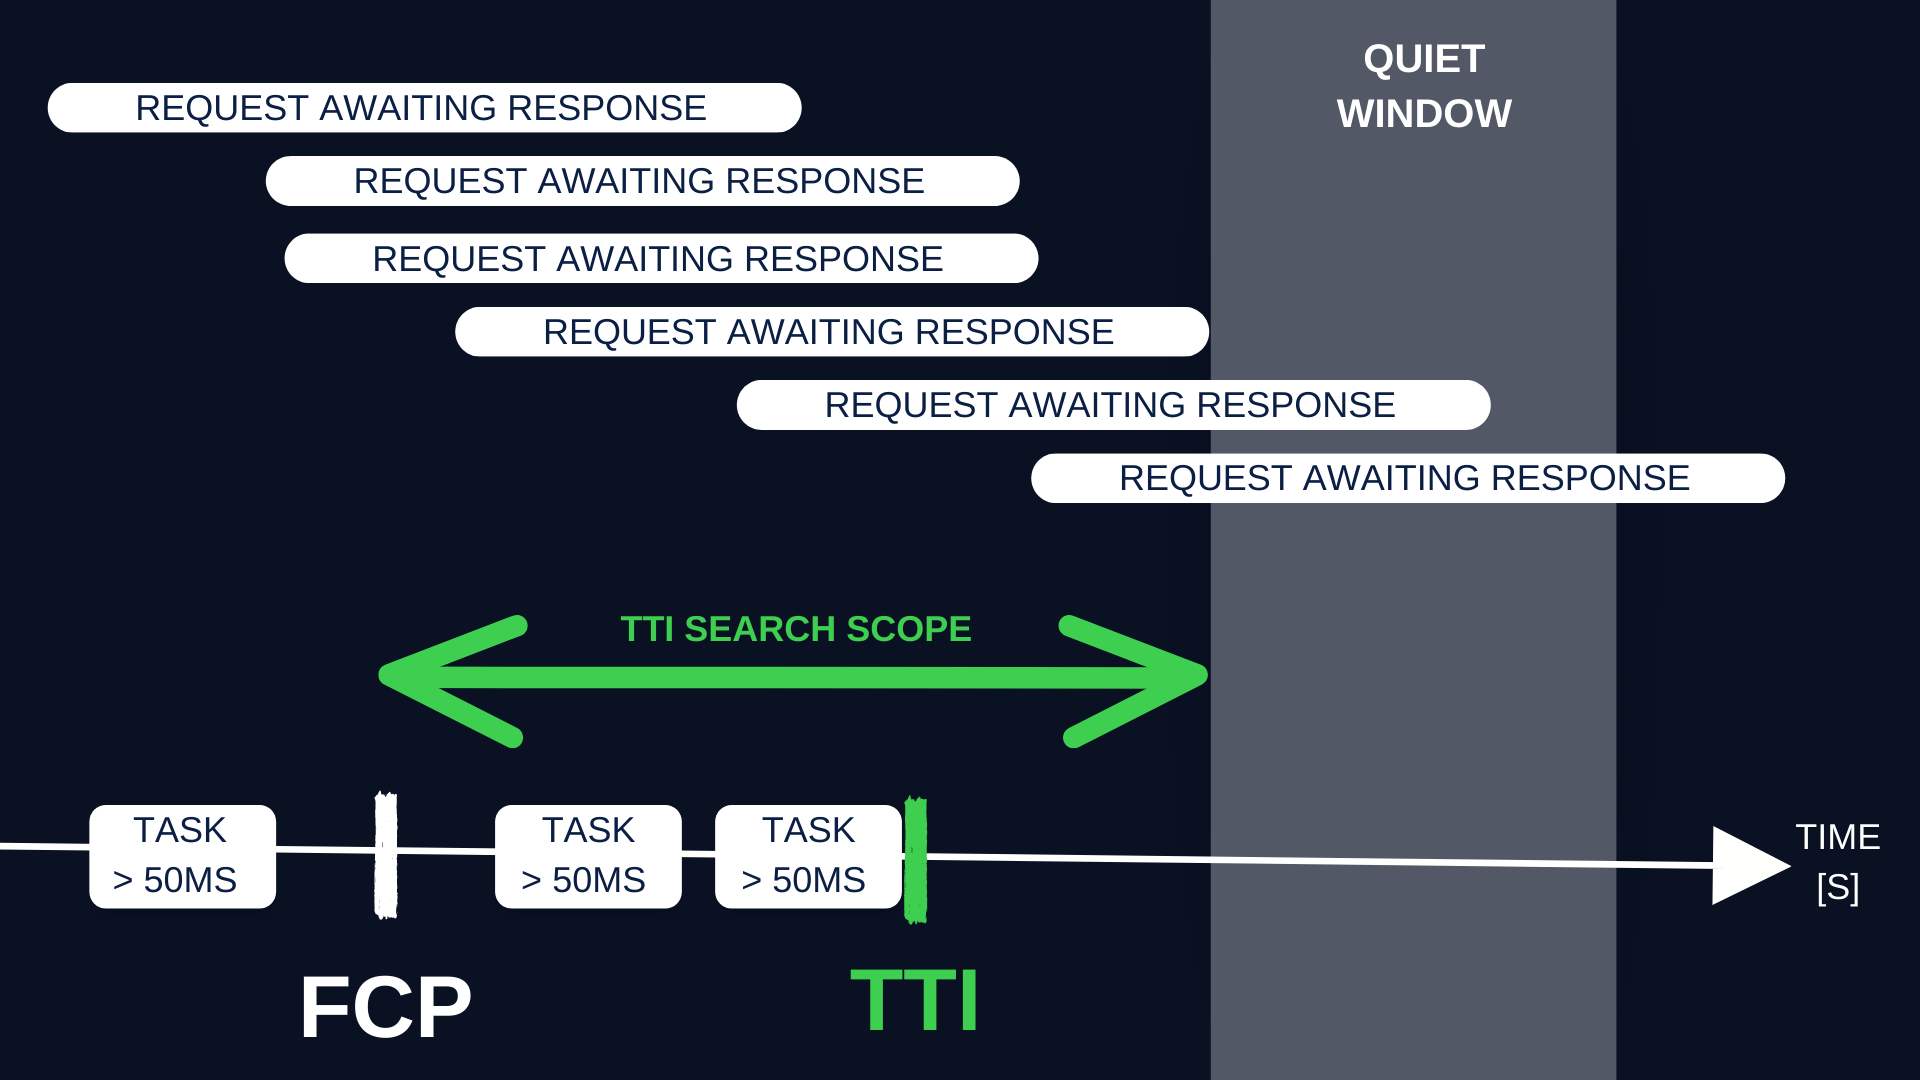
You can be certain that FCP will always occur prior to the quiet window. FCP and the commencement of the quiet window define the time frame within which you can identify your TTI.
Determining the final TTI score
Focusing just on that time scope, you should look for a moment when the browser finishes the last long task before the quiet window.
If FCP wasn’t followed by any task longer than 50ms, your TTI equals your FCP.
Time To Interactive vs First Input Delay
It can be confusing to tell apart the calculation of Time to Interactive and the measurement of First Input Delay.
Remember that First Input Delay measures the time it takes for a web page to respond to user interaction between First Contentful Paint and Time to Interactive. This way, it’s different from TTI, which measures the time until the page is fully interactive and not how long it takes for the page to react to a user action.
What is a good TTI score?
Your goal should be a Time to Interactive of under 5 seconds to ensure a satisfying user experience. This is a good TTI score according to Lighthouse.
How to measure TTI after the Lighthouse change
For a long time, the best way to measure TTI was to run a Lighthouse performance audit on your site.
However, currently, Google is changing its Lighthouse 10 tool by removing TTI and giving its score weight to CLS (Cumulative Layout Shift). CLS will now account for 25% of the overall performance score, and TTI will constitute 10% of that quarter.
The alternative tools to Lighthouse to measure TTI:
How to measure TTI with PageSpeed Insights
Google’s PageSpeed Insights retrieves its data from Lighthouse, so it’s possible that we’ll witness similar changes to its working in the future. However, as of the writing of this article, measuring TTI using PageSpeed Insights is possible and incredibly easy.
All it takes is copying and pasting the URL address of a page you’re interested in testing and clicking “Analyze.”
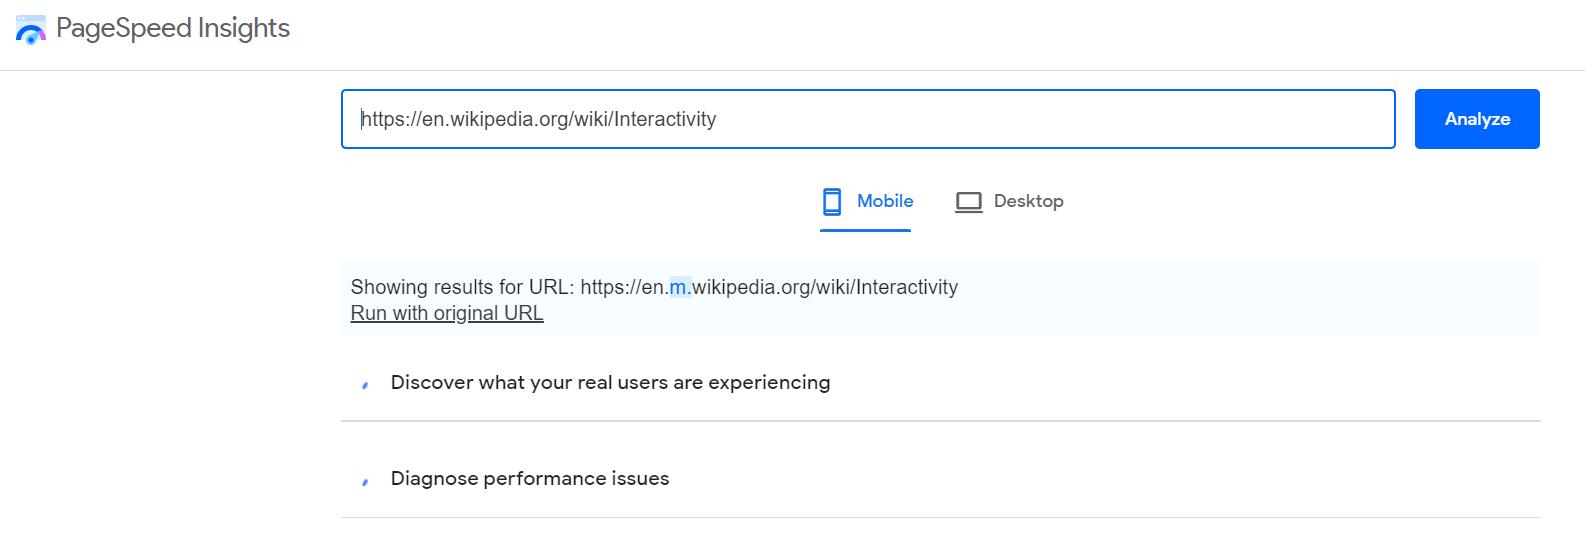
As you can see, you can compare how your page is doing on mobile and desktop devices.
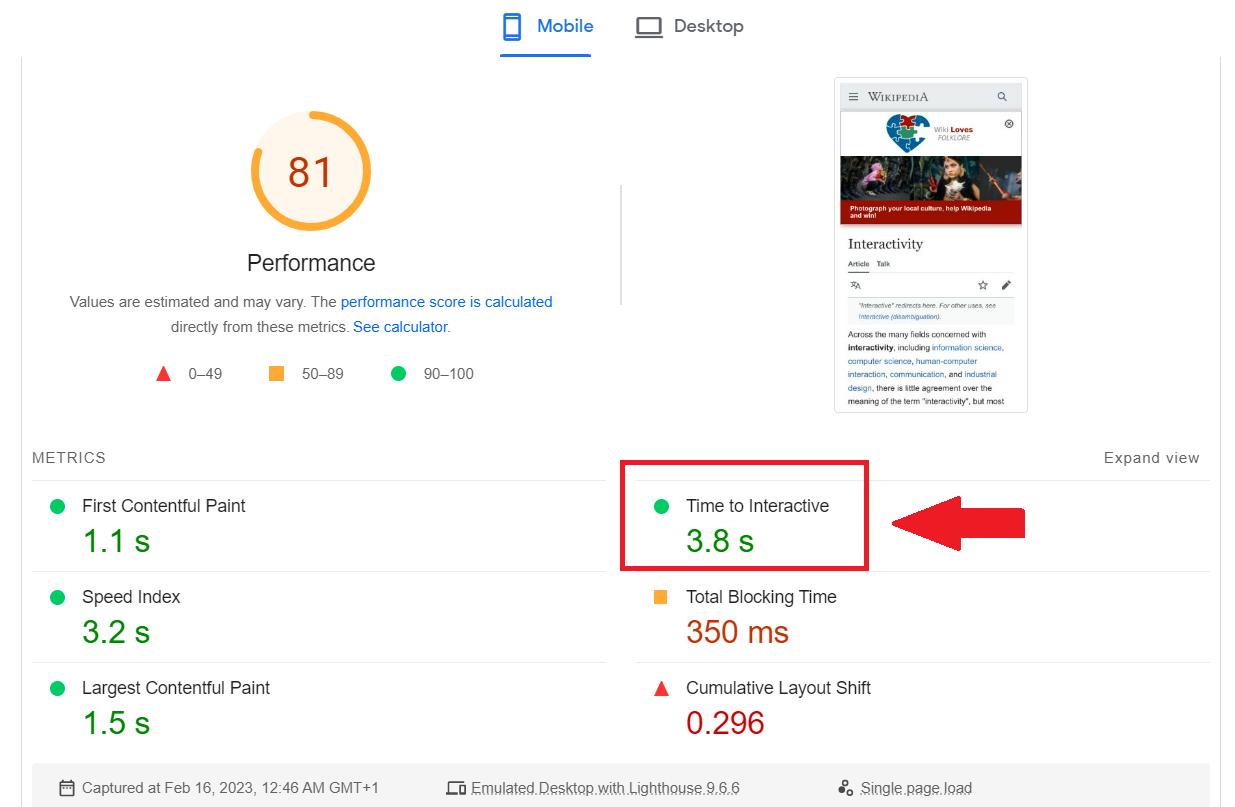
Your TTI score will be displayed in the “Diagnose performance issues” section. You may need to scroll down to see it after the report is ready.
How to measure TTI with Webpagetest
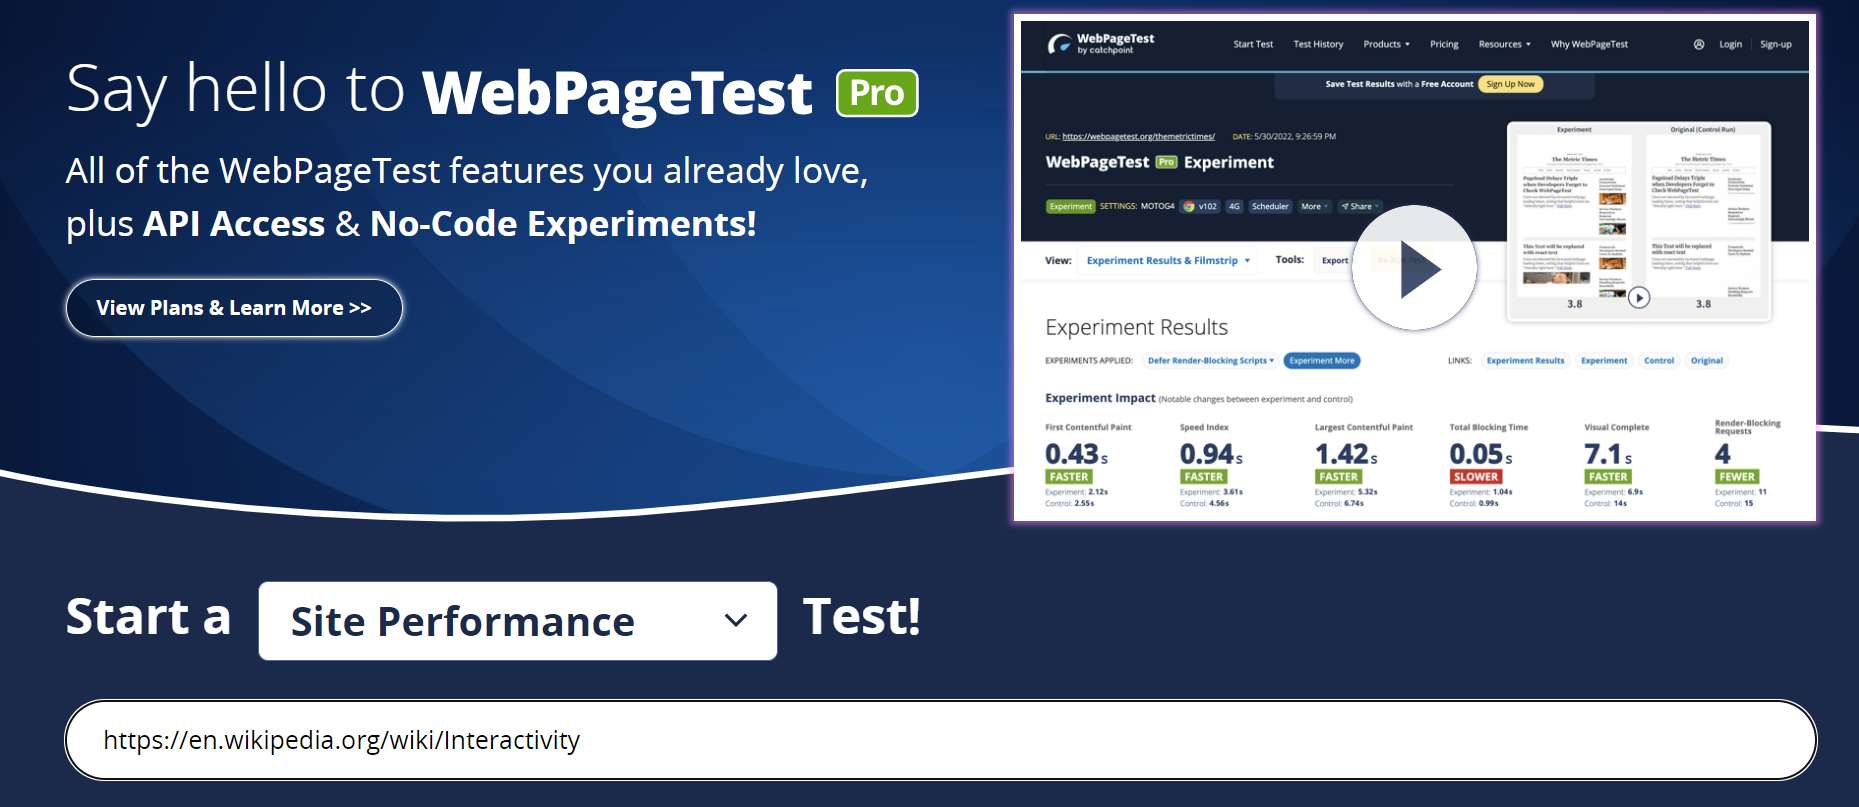
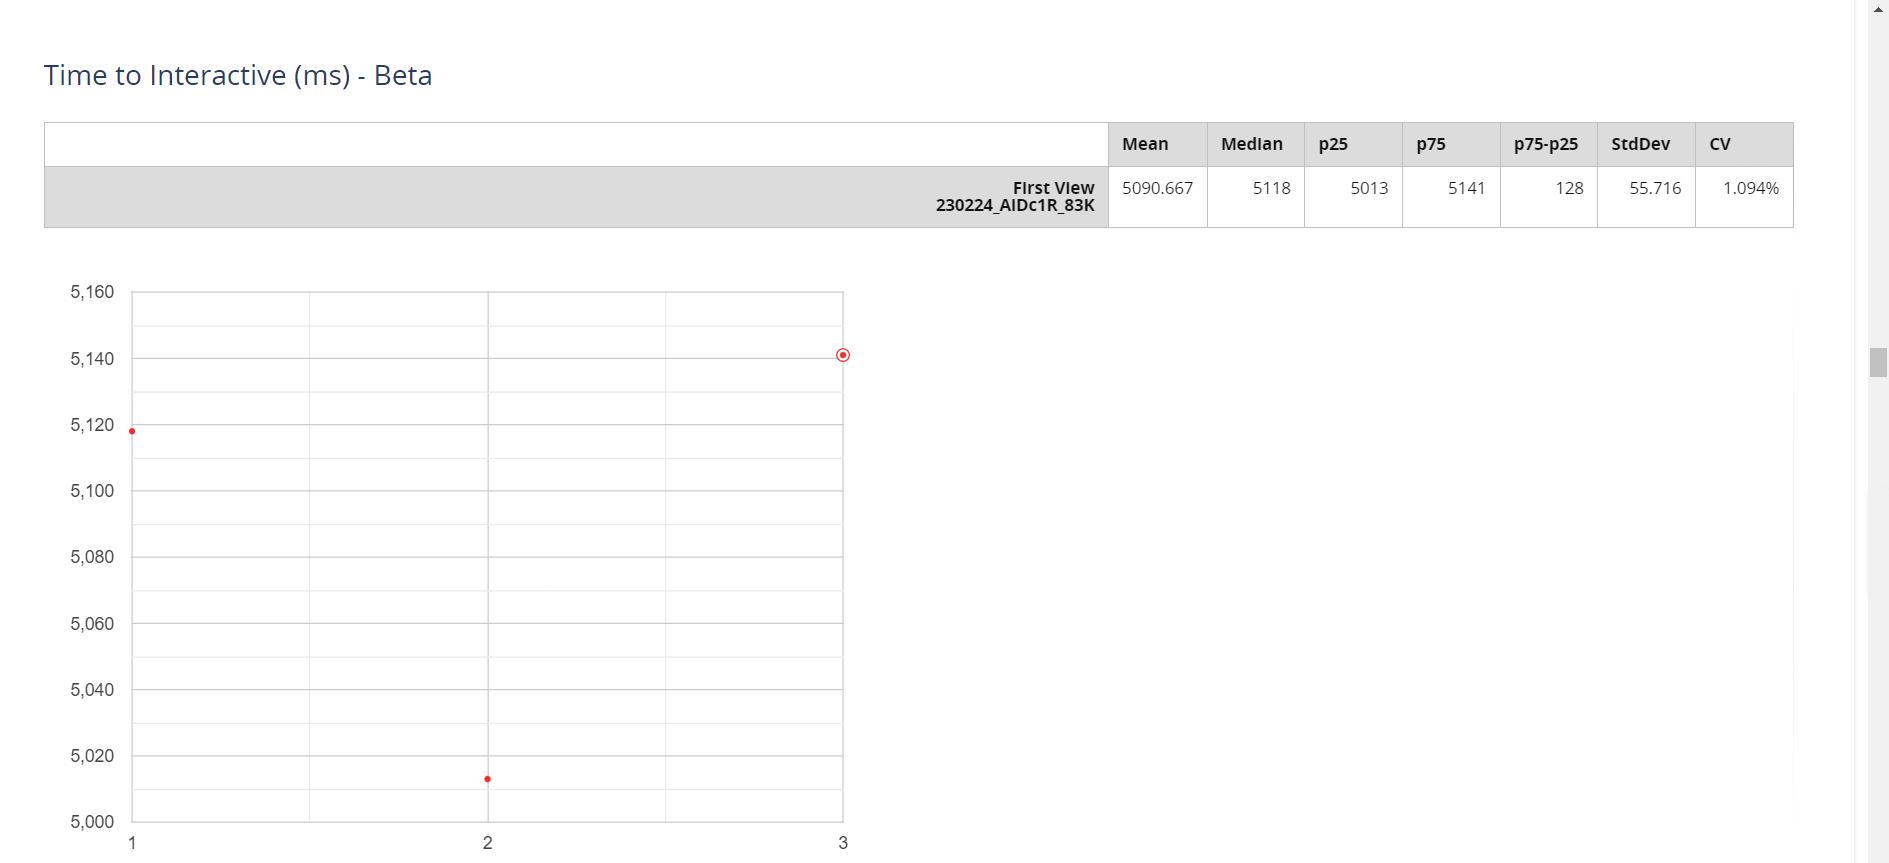
Go to Webpagetest and enter the URL you want to test.
If you want to see the Time to Interactive (TTI) score, you need to press the “Plot Full Results” button as it is not shown on the first results screen.
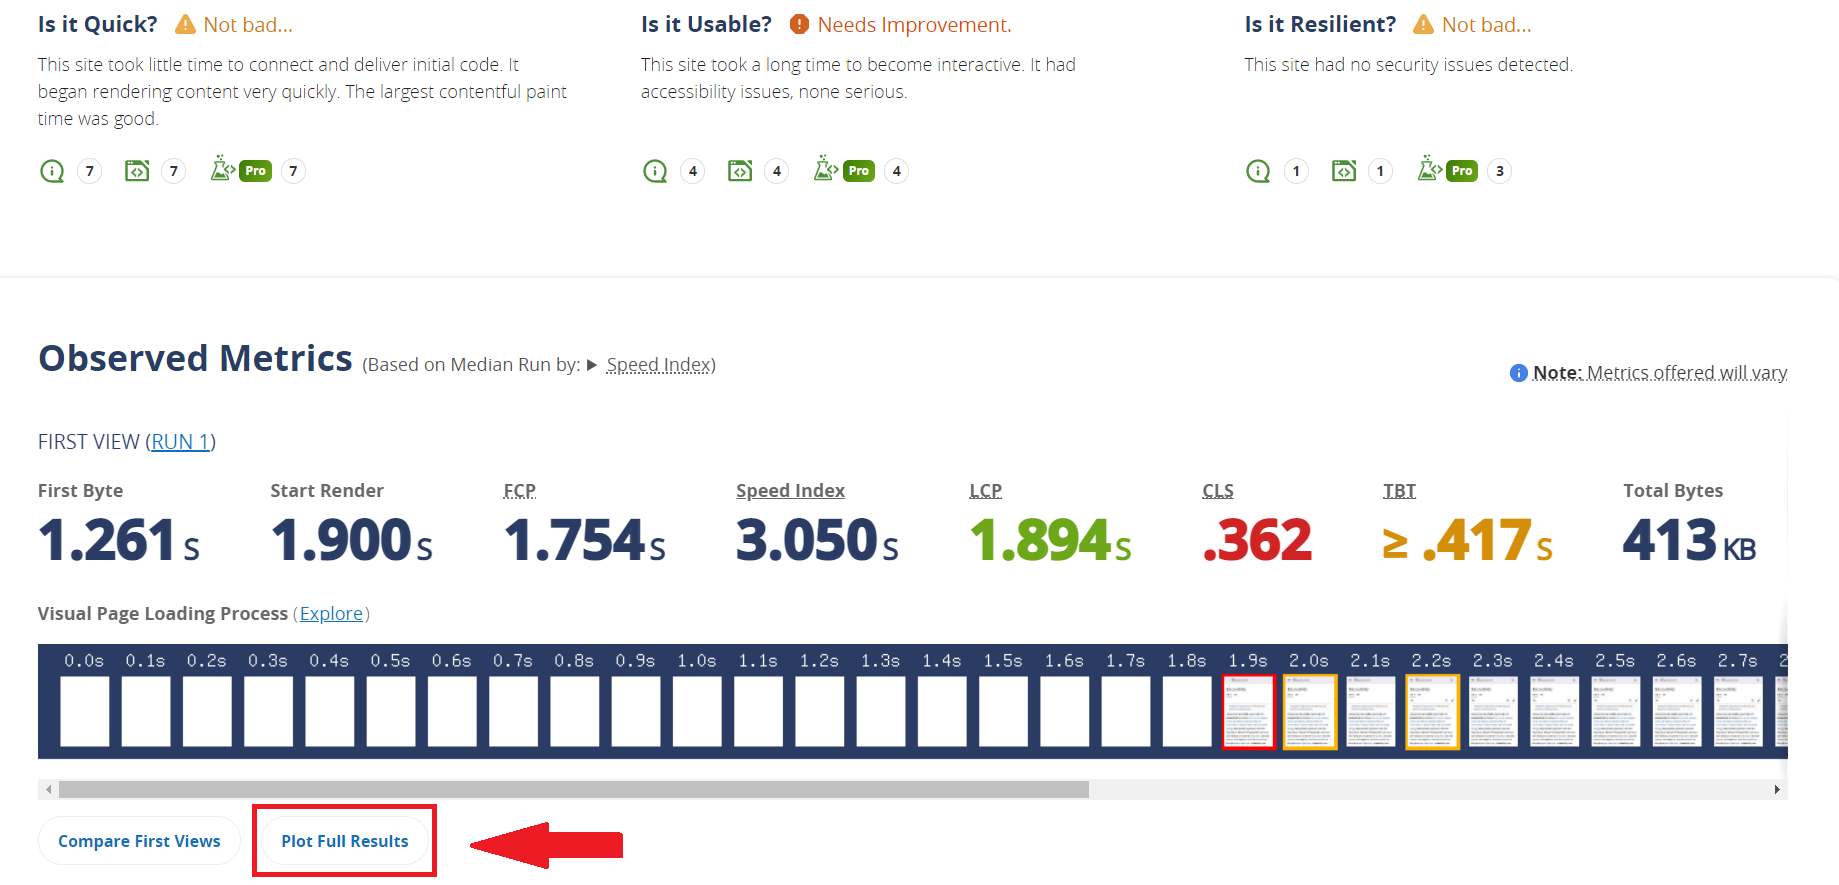
Scroll down to find your Time To Interactive stats.
What Causes A Slow TTI?
Slow TTI is primarily caused by the massive amounts of JavaScript used commonly used by modern websites. Long JavaScript tasks, those taking more than 50ms, can delay TTI by taking up a considerable amount of time on the main thread.
Since browsers depend on the main thread to complete various tasks, long tasks can make the page unresponsive until the task is done.
How JavaScript Influences TTI?
As soon as a user lands on a website, their browser begins downloading and executing JavaScript code. However, if this code is unoptimized and results in long tasks, it can cause delays in TTI.
Long tasks prevent the browser’s main thread from carrying out other crucial tasks, such as page rendering or responding to user actions.
In SEO, it’s commonly understood that while JavaScript can enhance a website’s visual appeal and interactivity, it can also negatively impact web performance. Specifically, when JavaScript code is the render-blocking resource, it can significantly slow down page loading times and create significant processing demands for browsers.
How to Improve Time To Interactive?
To enhance your TTI, there are two key factors at play – optimizing JavaScript code and reducing server response time.
How to optimize JavaScript to improve TTI
- Review your code to minify unused scripts,
- Compress the largest files found,
- Rather than overwhelming browsers by sending all the JavaScript code in one file, split the code and initially send only the necessary code that visitors need at the beginning,
- Delay third-party scripts, such as social sharing buttons, video player embeds, iframes for ads etc., while prioritizing scripts that provide the most value to the user,
- Implement the defer attribute to tell browsers not to wait for particular scripts, but continue to process HTML instead.
How to reduce server response time for better TTI
- Make sure you’re using a proper hosting service, ideally a dedicated one,
- Implement a Content Delivery Network to store content on servers located in close proximity to the user,
- Incorporate database optimization into your CMS,
- Apply pre-fetching techniques, such as rendering specific page elements in advance,
- Refrain from using web fonts that generate additional HTTP requests to external resources,
- Ensure that you update your server’s software on a regular basis.
It can be overwhelming to battle those optimization challenges on your own, so don’t hesitate to check Onely’s JavaScript SEO services or learn more about web performce services provided by our experts.
What about TTI in WordPress pages?
You can help your WordPress site achieve a better TTI score by usingplugins. Start by trying tools from the following list:
- Closure Compiler – Google’s tool designed to optimize the performance of JavaScript by analyzing and compiling code to create a more efficient way of serving JavaScript. It achieves this by removing dead code, rewriting and minimizing remaining code, and checking syntax, variable references, and types.
- Flying Scripts – a plugin that makes your pages wait with executing JavaScript until there is no user activity. It lets you choose which JavaScript scripts should be deferred and has a timeout feature to run the scripts after a set period of inactivity.
- Plugin Organizer – a tool for WordPress that lets you control the loading order of your plugins, disable certain plugins based on post type or URL, and organize your plugins on the admin page by grouping them.
- Gonzales – a lightweight plugin that enables the conditional disabling of CSS, JS, and plugins based on the page being visited. It helps to simplify website load times by removing redundant CSS and JS files that may be registered by themes or plugins.
- Rocket CDN – a plugin that uses a Content Delivery Network to improve website performance. It integrates with the Rocket.net hosting platform to provide optimized CDN services for WordPress websites.
TL;DR
TTI stands for Time To Interactive. It’s a website performance metric that measures the time it takes for a website to become fully interactive for users.
As a web page loads, the browser executes scripts and sends resource requests to the server. The “quiet window” occurs when the browser can take a break for at least five seconds without executing any long tasks or having more than two resource requests open. To identify TTI, you need to focus on the time between FCP and the start of the quiet window and observe when the browser finishes the last long task before the quiet window.
Google’s Lighthouse 10 tool removed TTI and focused on CLS (Cumulative Layout Shift) instead, but measuring and optimizing your TTI can still improve user experience.
To improve TTI, optimizing JavaScript code and reducing server response time are key. Your goal should be achieving a TTI score under 5 seconds.