Posted by
Shay Harel
After a long wait, we finally saw the May Core Update. When the update started, the Rank Risk Index reported ******* SERP fluctuations starting on May 26th. Fluctuation levels quickly returned to normal the following day and remained that way until Google announced that the update was over.
However…
The story was far from over.
We then saw ******* SERP fluctuations starting again on June 20th. What’s more, the fluctuations continued all the way to June 29th.
![]()
We can only speculate that the updates are related.
Before I get into the actual data, I want to touch on the main metric we used in our analysis and why.
Traffic Change – A Clear Snapshot of the Google Landscape
Over the last few years, we’ve seen the Google SERPs change dramatically. In the early days of Google, the goal of SEO was always to rank in position one.
Well, as you know, Google’s SERP features were a game-changer. We began seeing more and more answers in the SERPs without the need to click through to the URL itself.
This pushed SEOs to focus on SERP visibility instead of simple rankings. SERP visibility attempts to show traffic potential by measuring rankings against other metrics like search volume.
The problem is, Visibility and Rank changes don’t accurately reflect organic traffic to a website.
For instance, you might see a 50% increase in visibility to a site according to ranking data but in practice you only see a 10% increase in traffic.
There might be two reasons:
- The search volumes used to estimate visibility metrics are often far from reality.
- The 50% ranking increase might result in less traffic than expected because a portion of the traffic might go to paid advertising while another portion might not result in a click at all.
This pushes us to analyze Google updates from a different vantage point.
Organic Traffic Change.
So, with the help of Similarweb’s data analysts, we pulled out organic traffic data and analyzed the volatility of sites across both updates.
Organic Traffic Change is a much more powerful metric because it shows you the actual impact on traffic rather than guessing how much traffic a site will get based on ranking changes.
So, let’s jump into the data…
Average Traffic Change
As you can see in the screenshot below, the May Core Update yielded a 27.81% change in traffic. The June update yielded 24.49% traffic change.
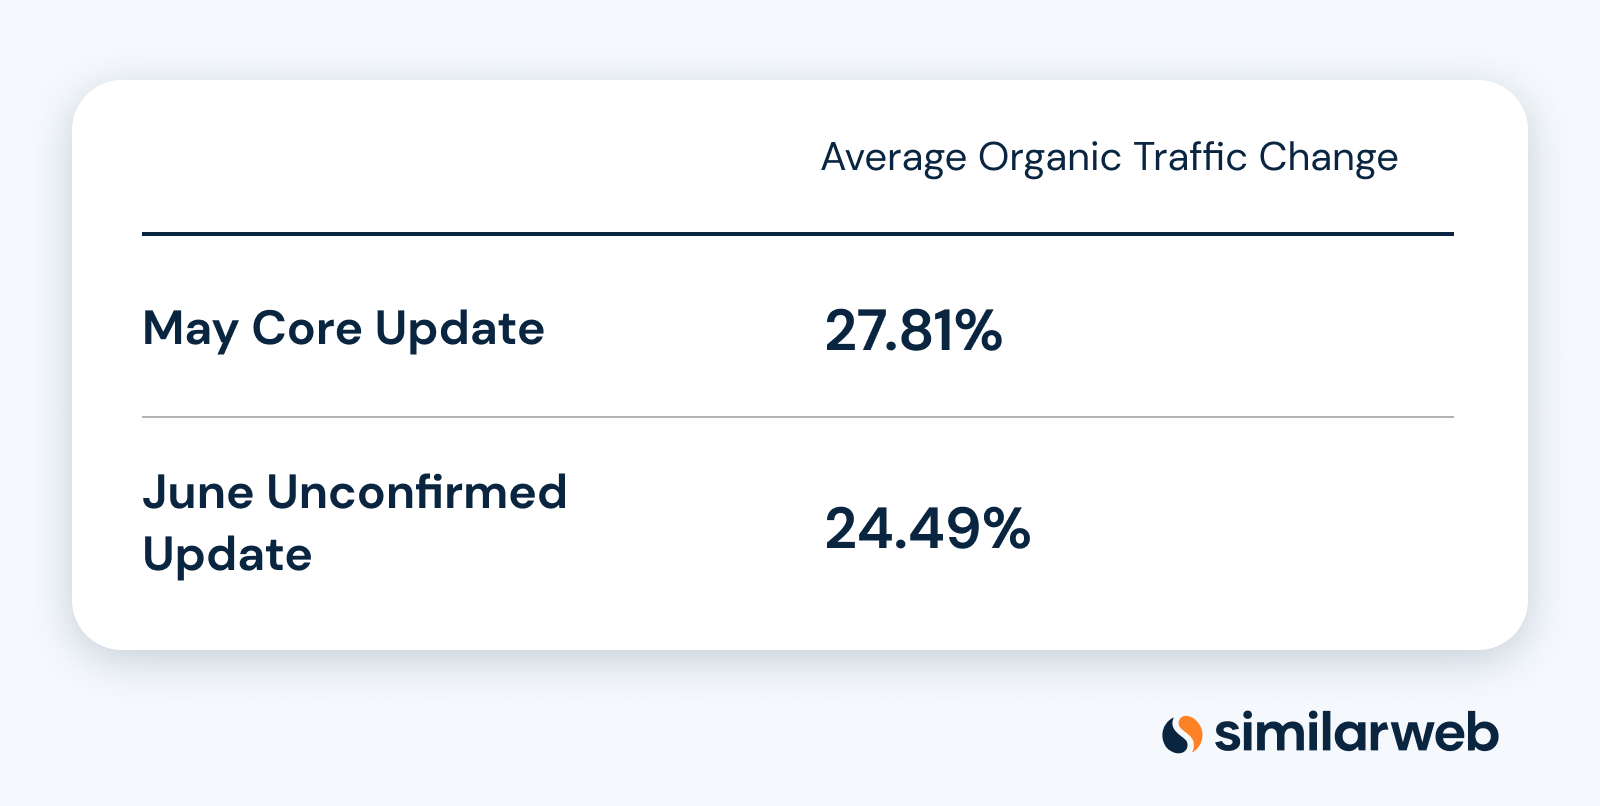
What strikes me off the bat is the unconfirmed update was almost as significant as the core update.
Now, in general, we’d expect a core update to affect many niches and verticals across the web. The reason is Google is making significant changes to its algorithms. An unconfirmed update is generally less significant and we can speculate that unconfirmed updates are more locally focused.
The size of the update leads me to assume that there is a connection between them. Especially if we consider that the June update hit just around two weeks after Google announced that the May update had completed rolling out.
What’s more, if we look at ranking fluctuations, we see the same thing.
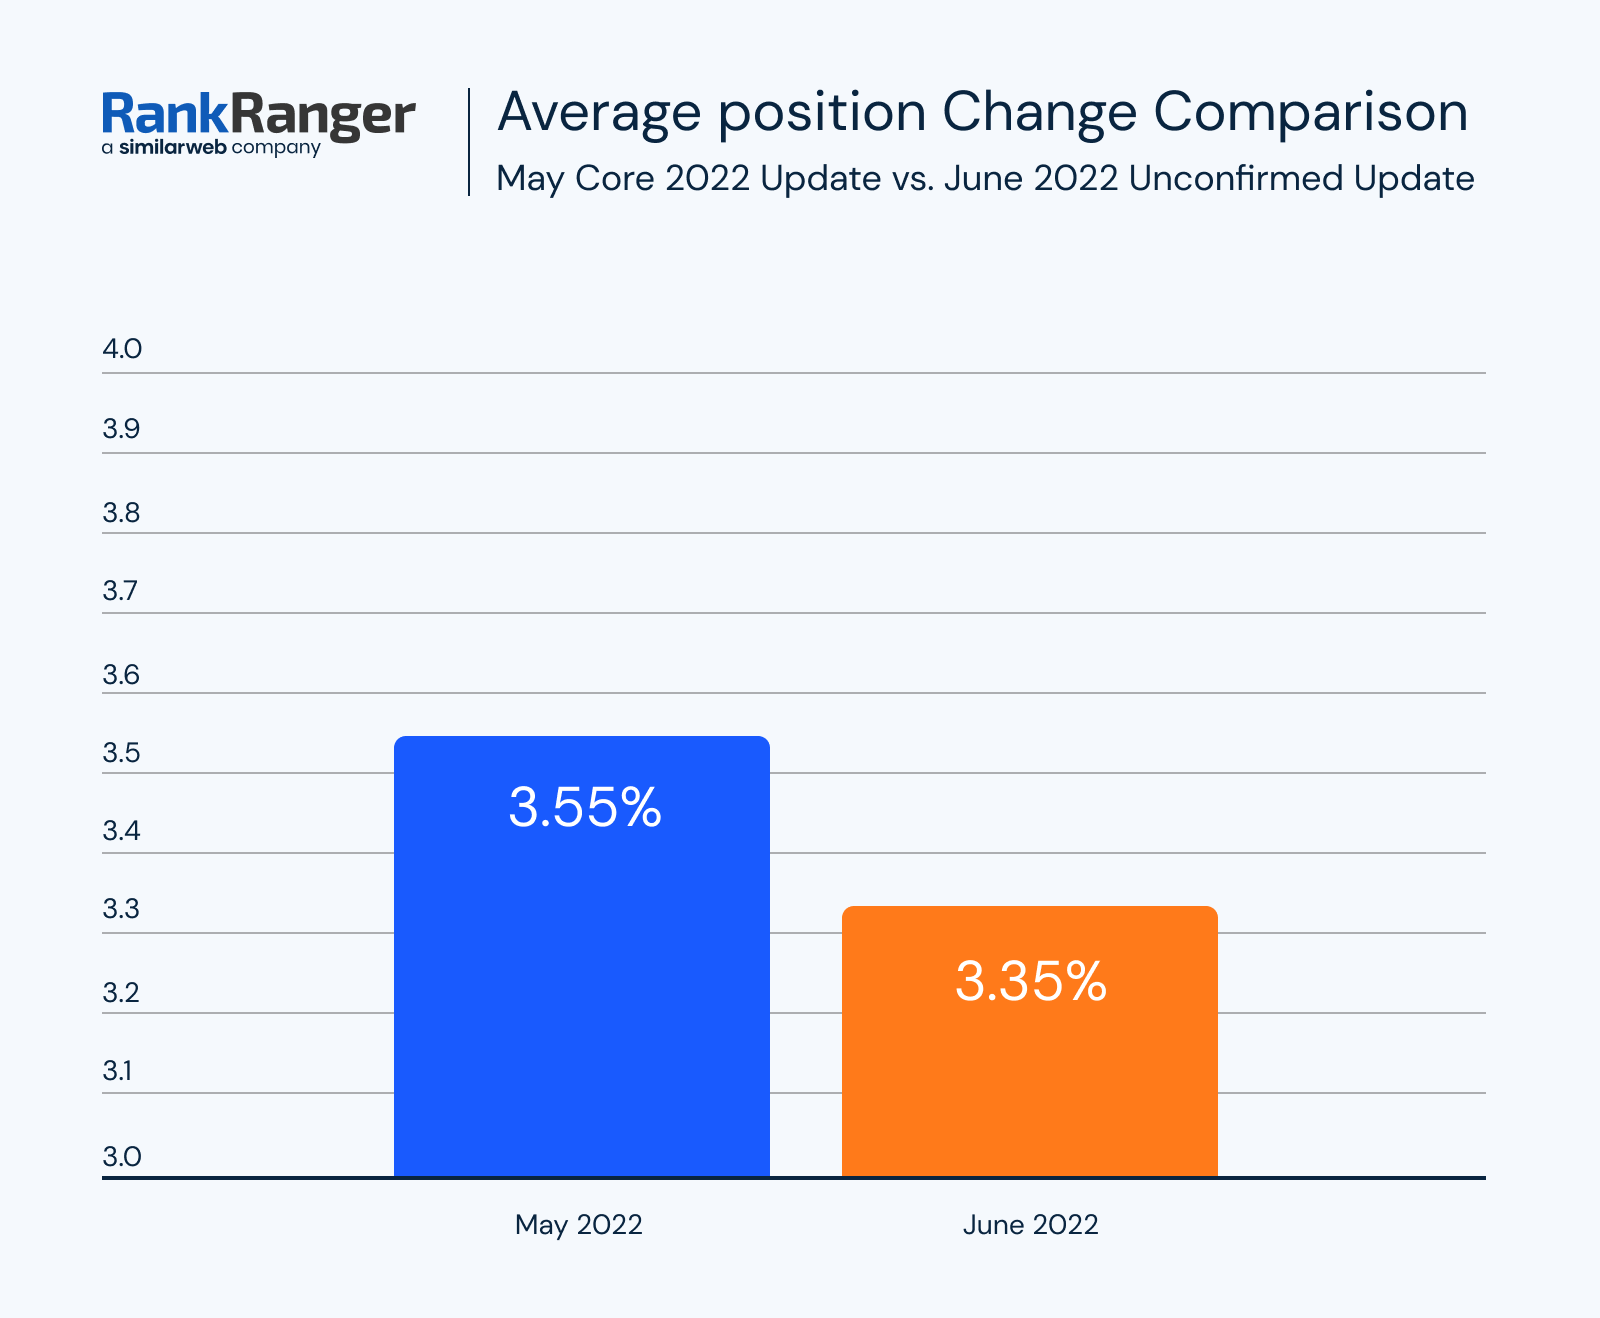
As you can see in the screenshot above, the June update fluctuations were fewer than the May update. But if we compare ranking fluctuations to the December 2021 update, we see similar levels of fluctuations.
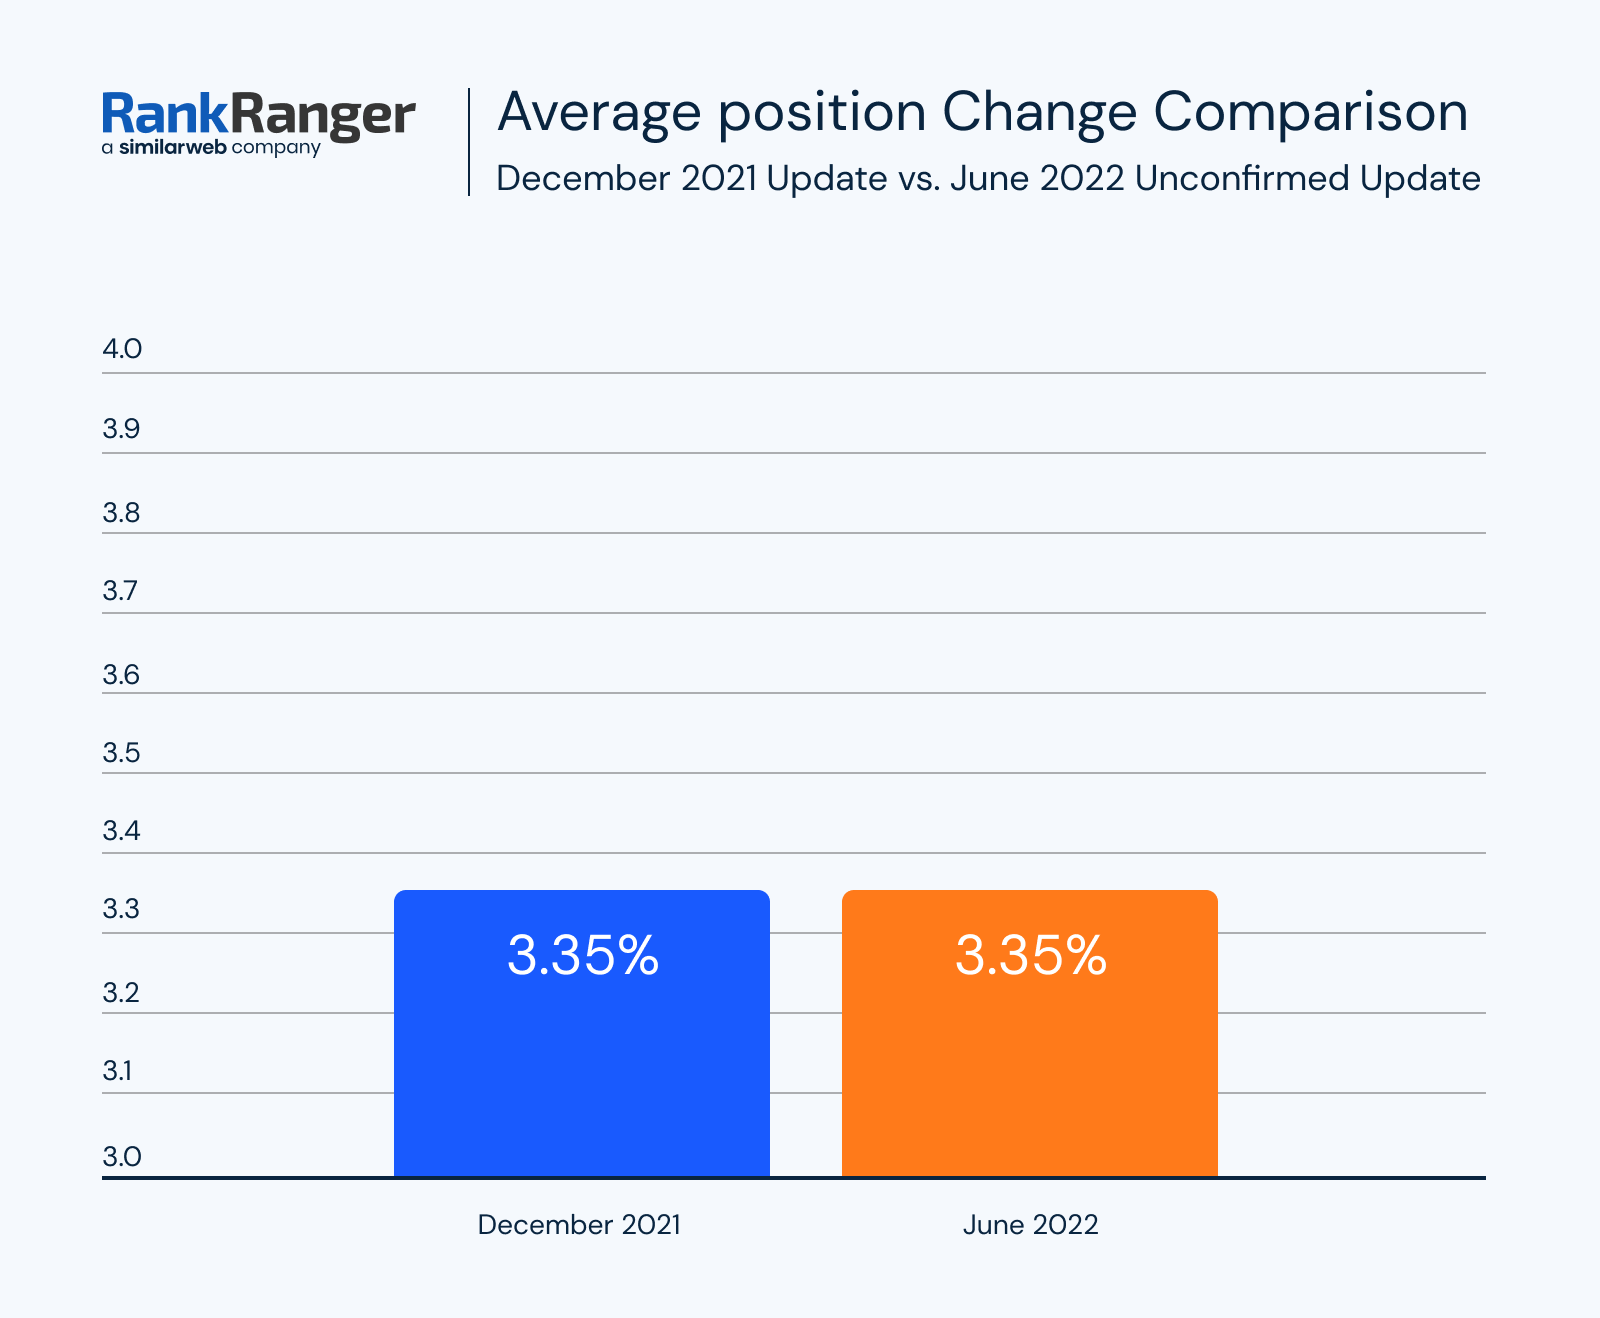
We see that both traffic changes and ranking fluctuations for the June update were comparable to a core update.
Now that we’ve seen the big picture, let’s see how traffic changed over the top sites in Google.
It’s important to understand that changes to traffic might be based on many factors and it is impossible to truly understand how Google changed its algorithms.
But we can draw insights based on patterns we are seeing.
May Core Update Organic Traffic Changes
Let’s look at the sites that had the biggest changes to their traffic during the May update. The May update hit hard and fast on May 26th with ranking fluctuations returning to normal the next day.
![]()
Here are the top traffic changes.
Top 30 Traffic Gains and Losses
In the data below you’ll see the sites with the biggest traffic changes overall for the May Core update. We are sorting the data by the overall traffic impact across the net and not by measuring the percentage traffic a particular site gained.
Here are the top 30 traffic gains.
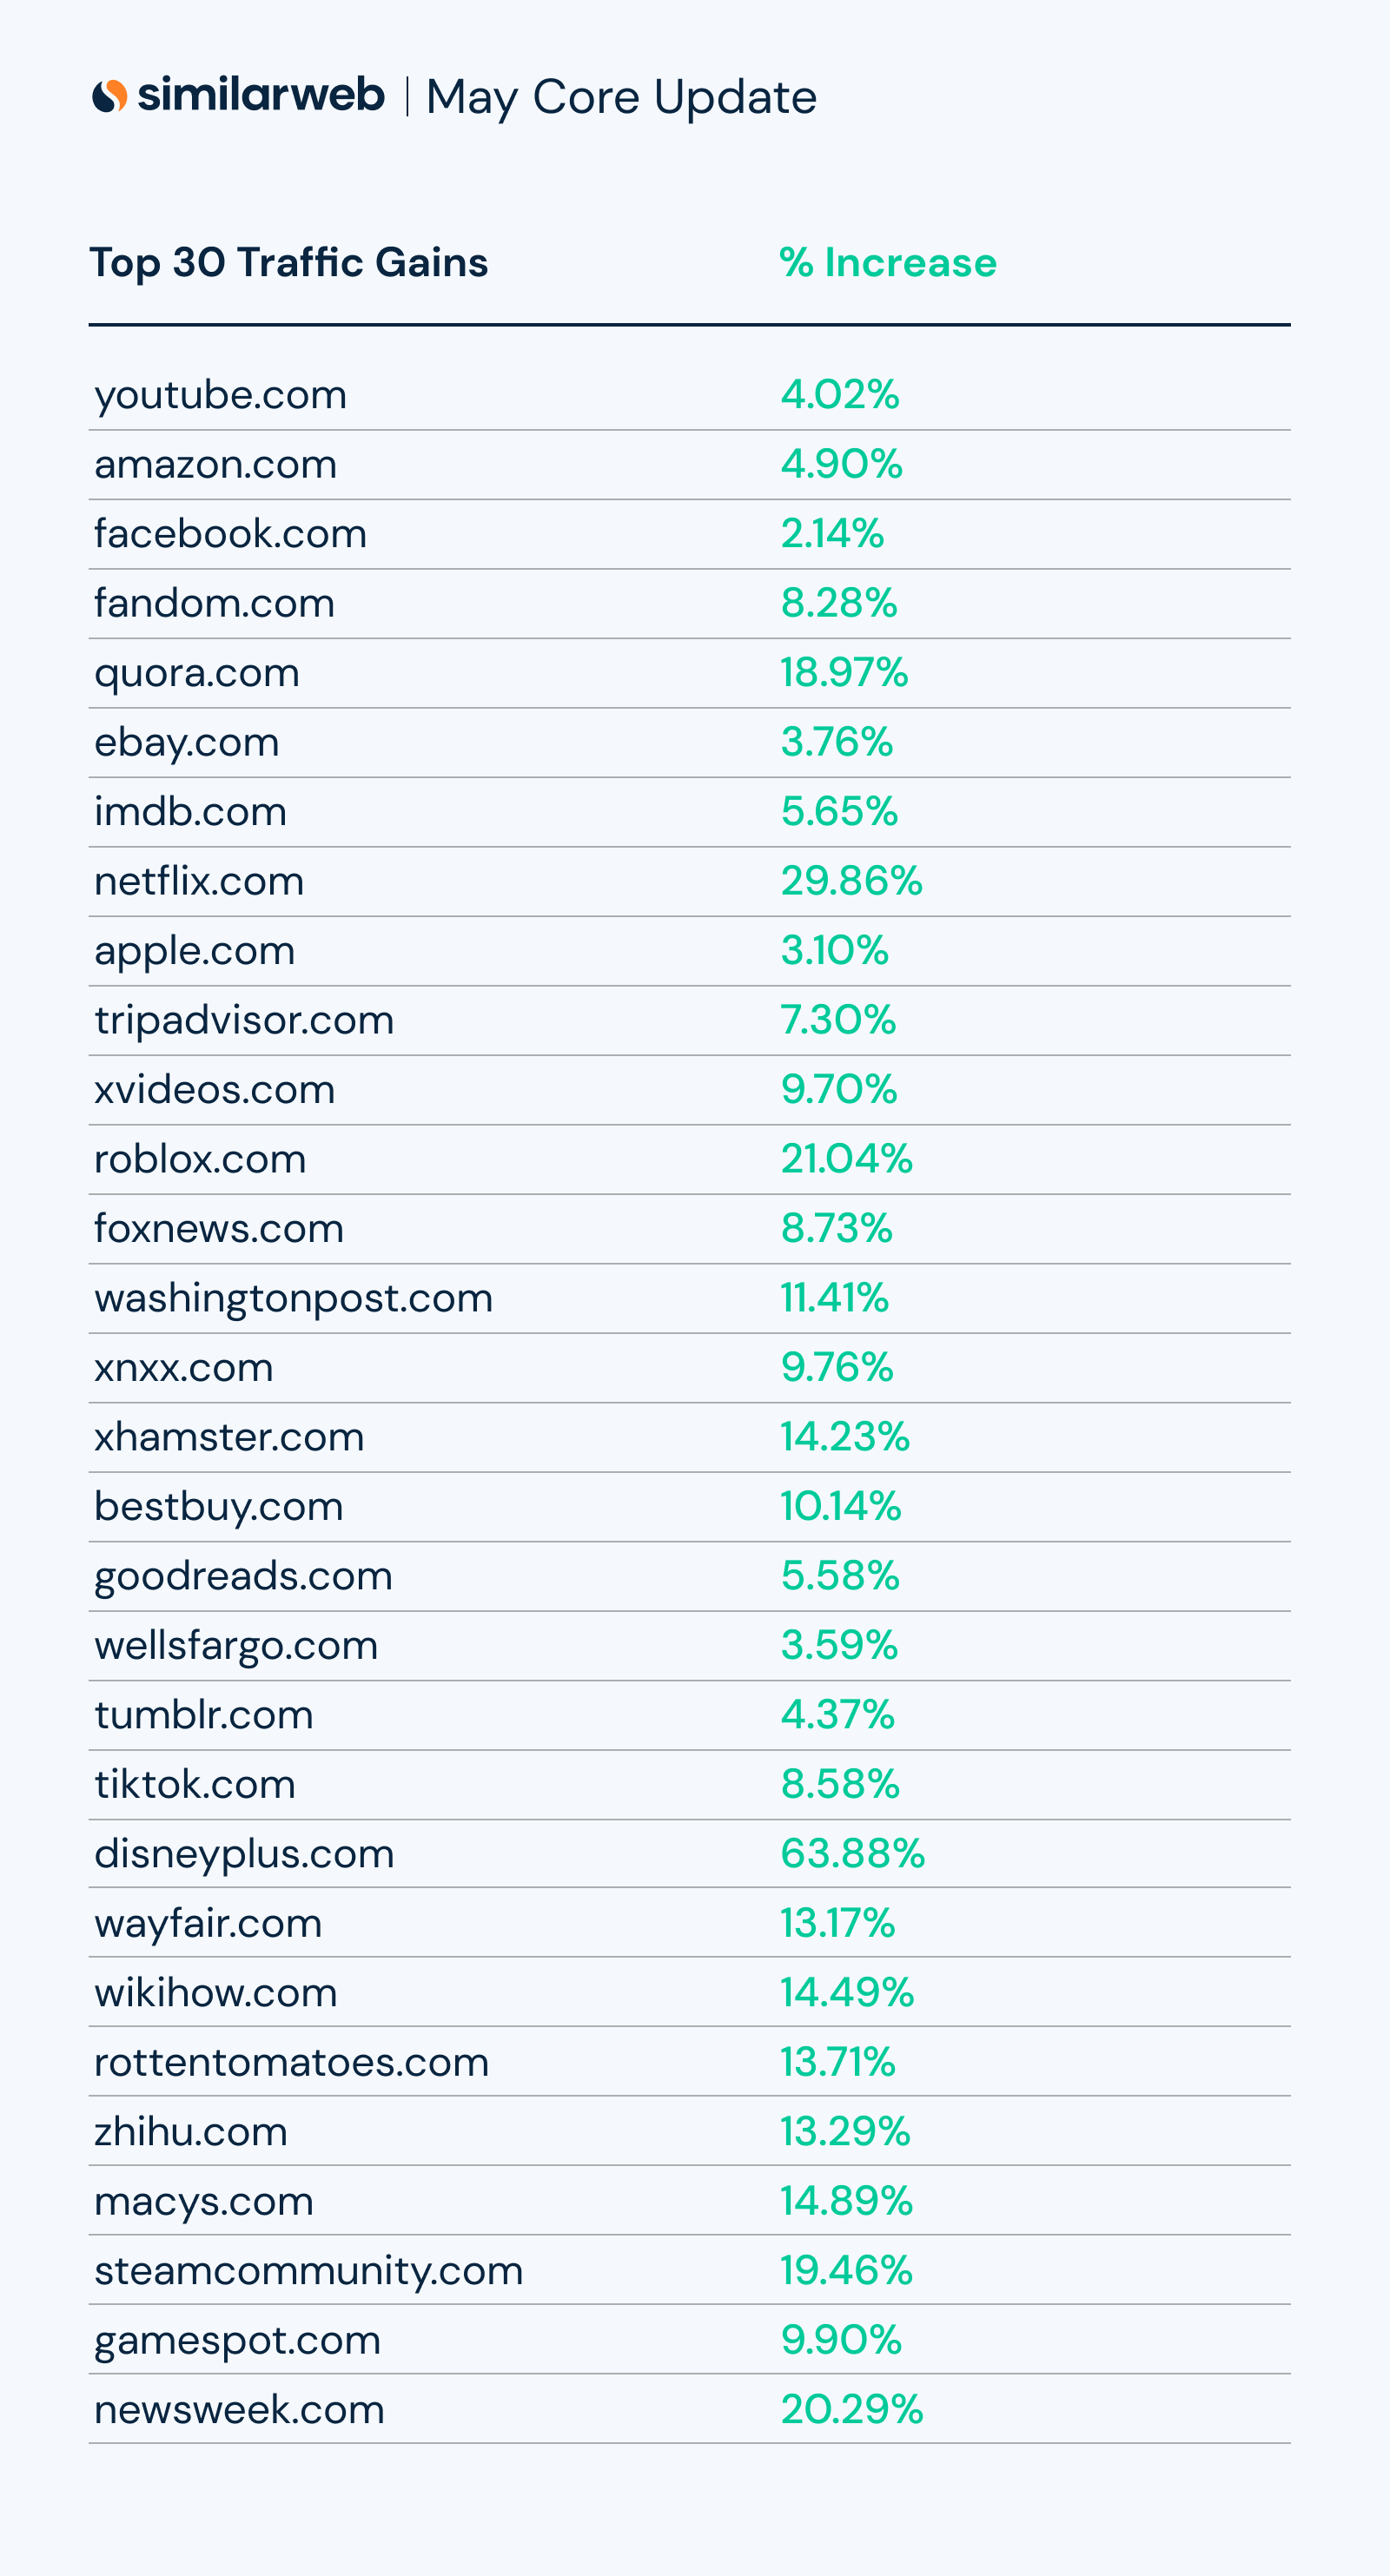
Looking at the top winners we have some interesting results.
Yes, we have some obvious winners in the social media industry, but what stands out are the **** sites and news sites that gained substantial traffic. Also, Disney Plus had a whopping 63% traffic gain.
There were other sites that had significant gains like Netflix and the gaming Platform, Roblox.
Below are the top 30 sites where traffic declined.

Looking through the list where traffic declined, the vast majority are in the education niche. I haven’t looked through every site but here are a few.
- Schoology.com
- Clever.com
- Cuny.edu
- Quizziz.com
- Myschoolapp.com
- Sparknotes.com
- Edgenuity.com
- Classlink.com
- Mathway.com
- Ixl.com
- Powerschool.com
- Abcya.com
Did the education niche as a whole lose traffic? I’ll touch on this later.
Top 10 Traffic Gains and Losses
The data shared below is not based on the sites with the biggest traffic, but rather shows the sites that had the most significant changes to their traffic.
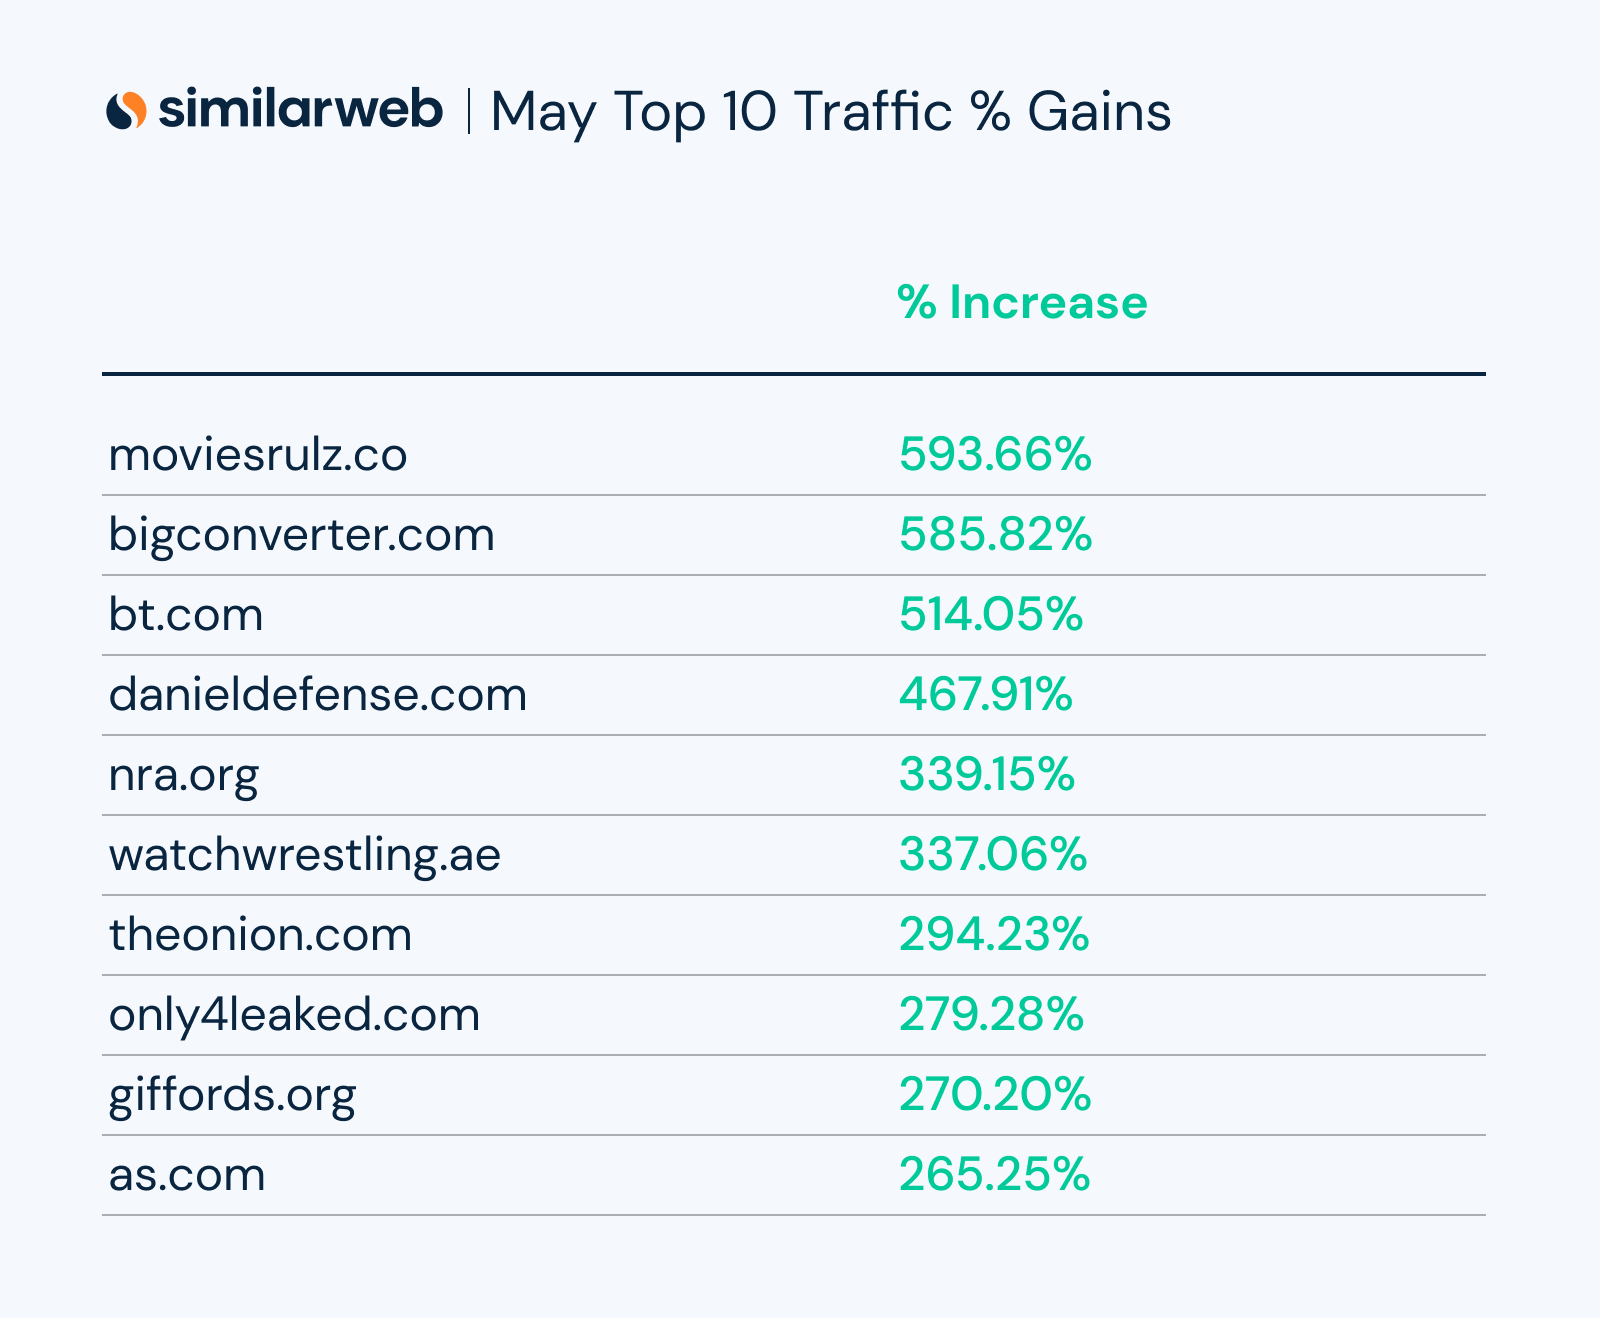
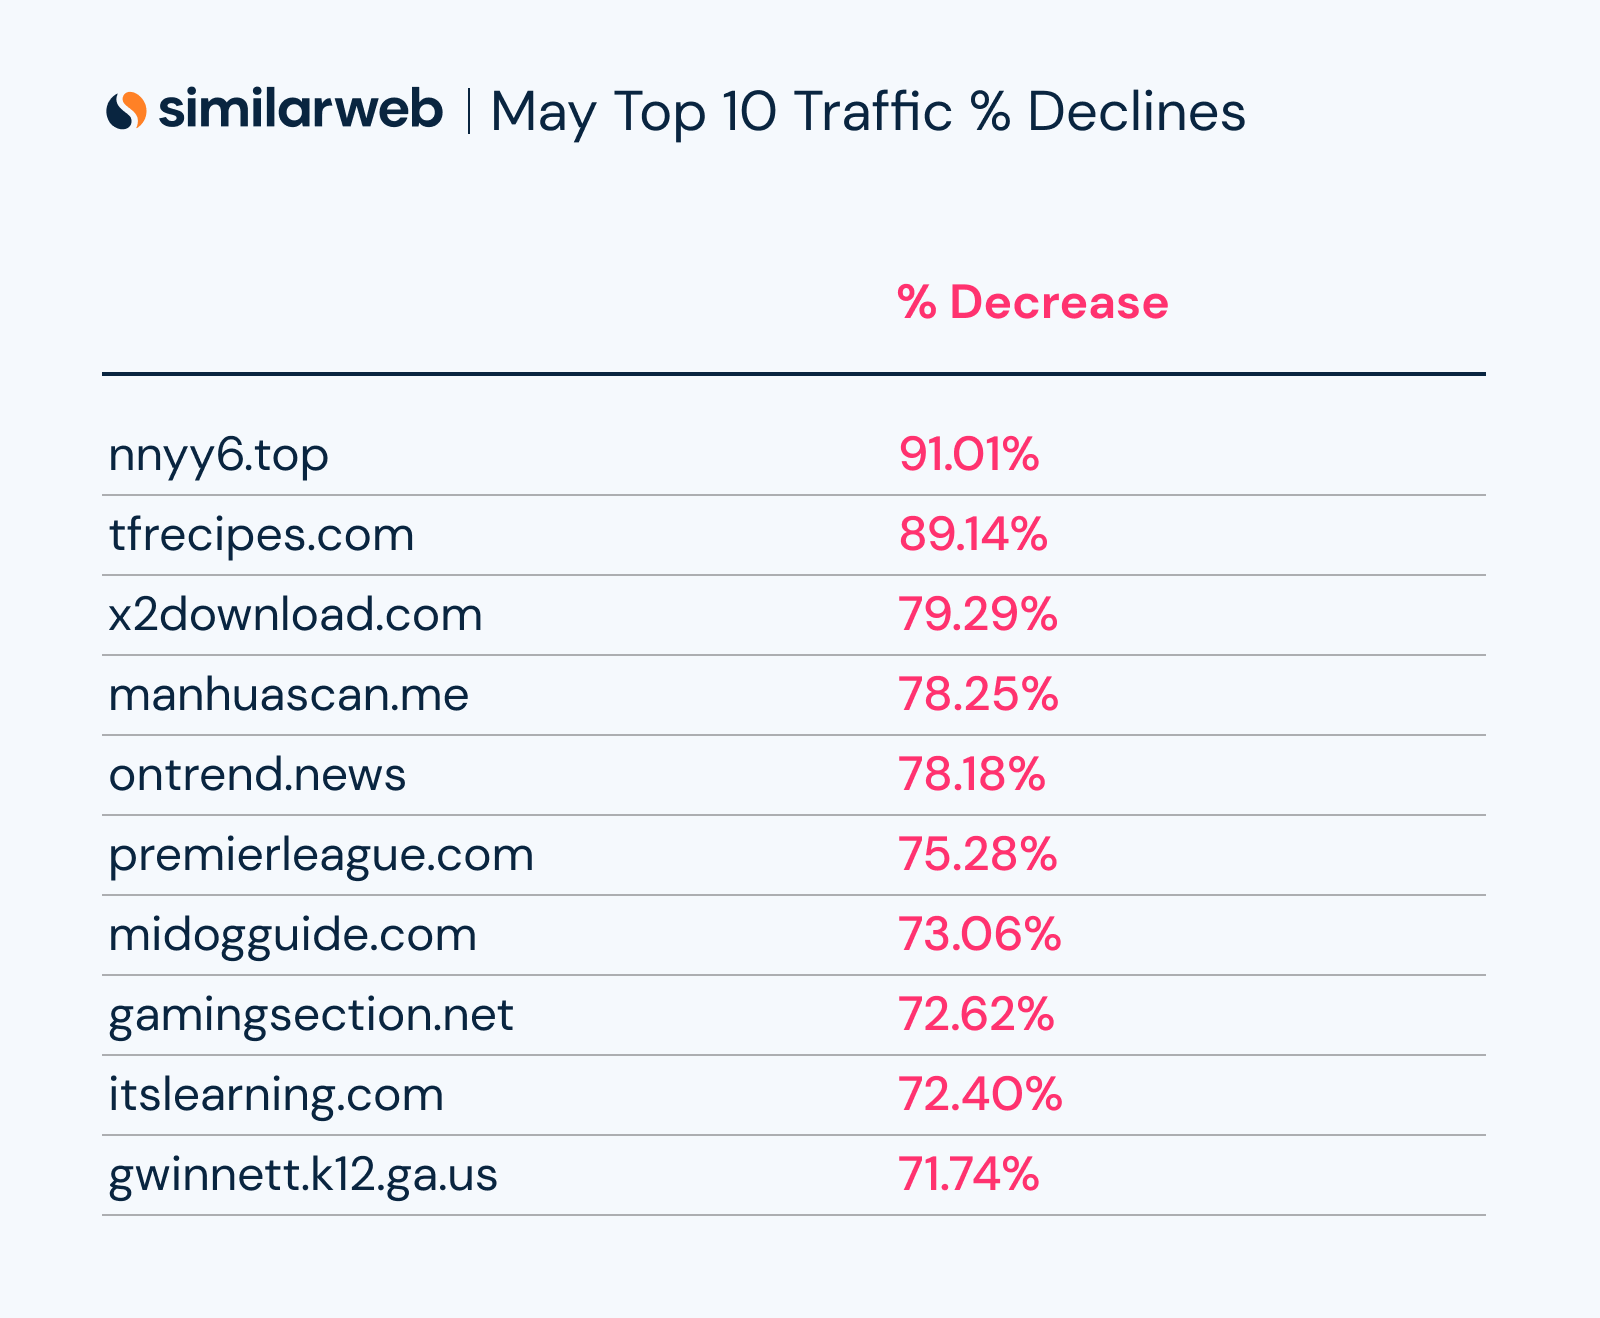
Below are the sites that had the biggest traffic declines.
Okay, we’ve seen the May update, now let’s look at the data for the June unconfirmed update. Once we do that, we can perhaps better see if there is a connection between the updates.
June Unconfirmed Update
The June update started on June 20th and burned white-*** until June 28th.
![]()
Here are the top traffic changes.
Top 30 Traffic Gains and Losses
In the data below you’ll see the sites with the biggest traffic changes.
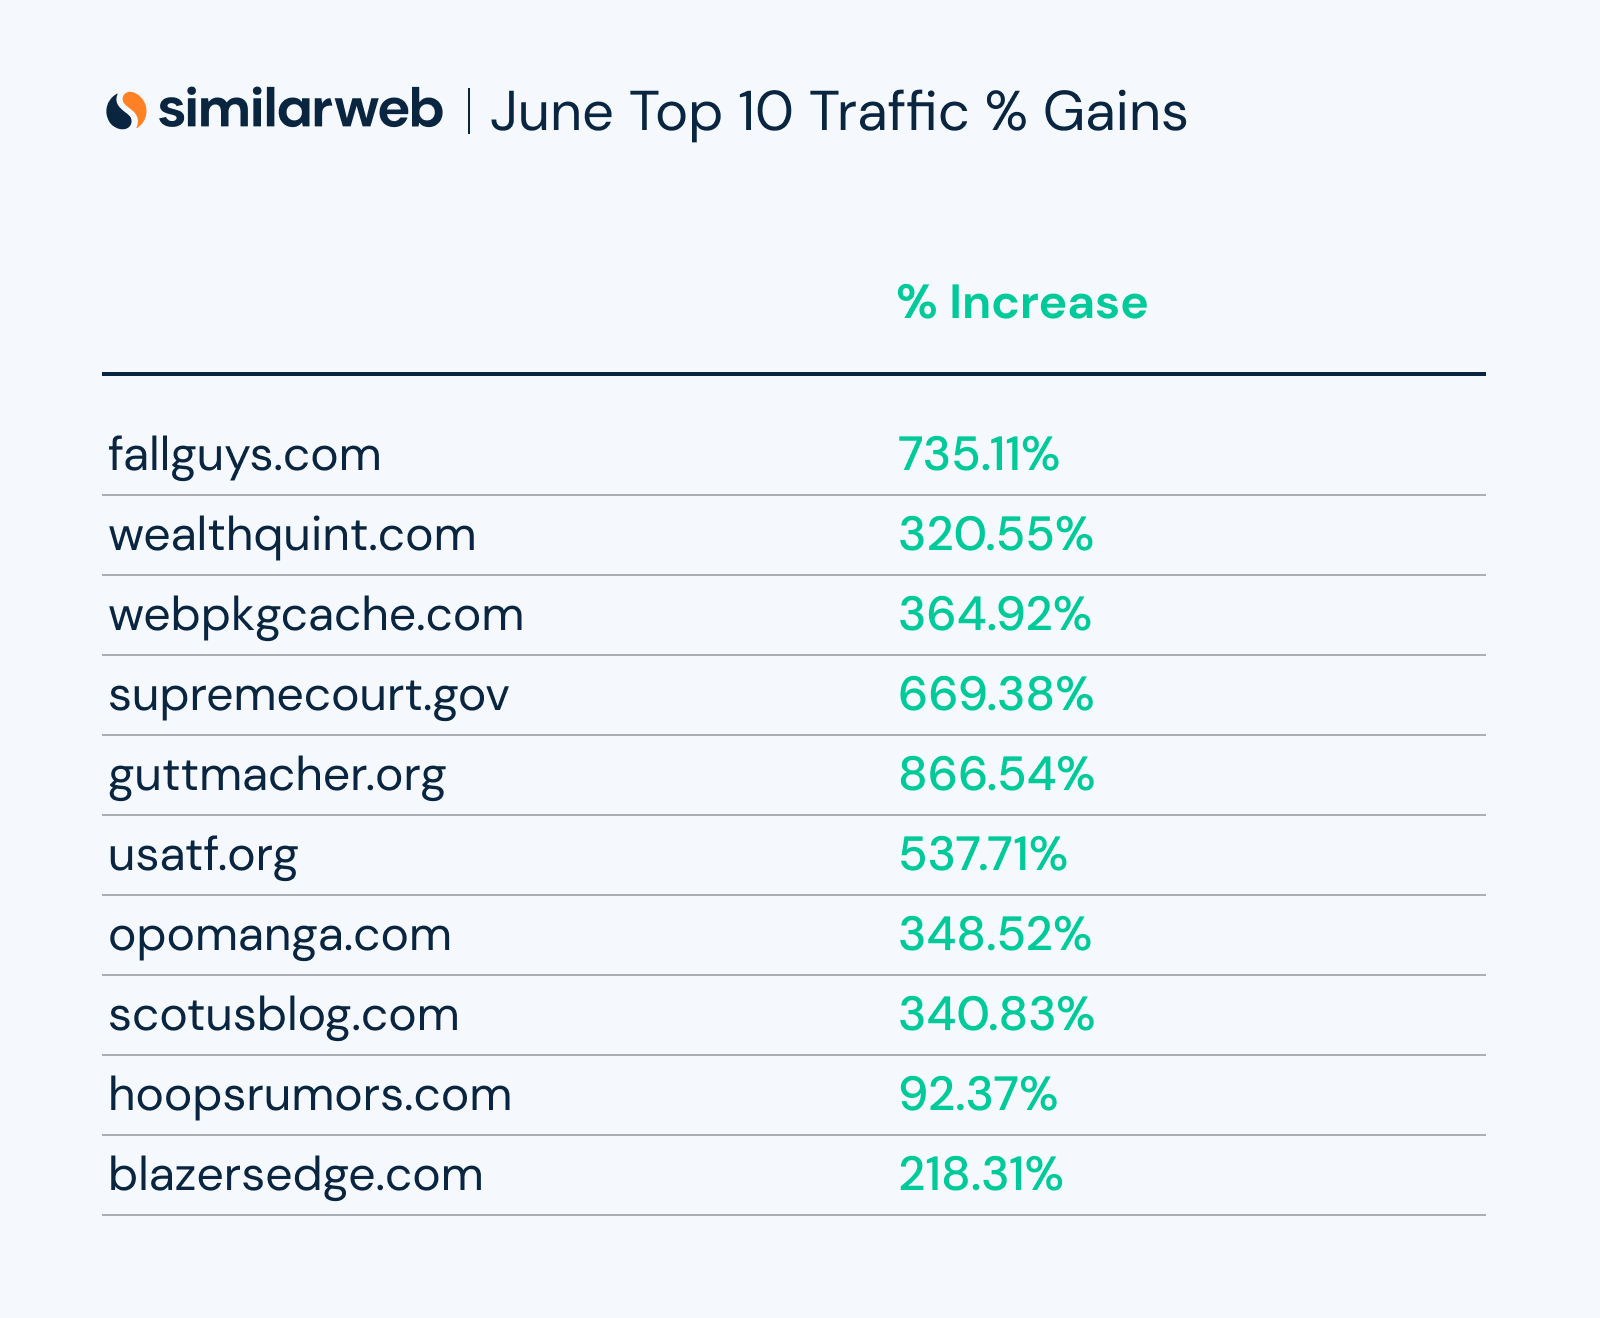
Here are the top 30 traffic gains.
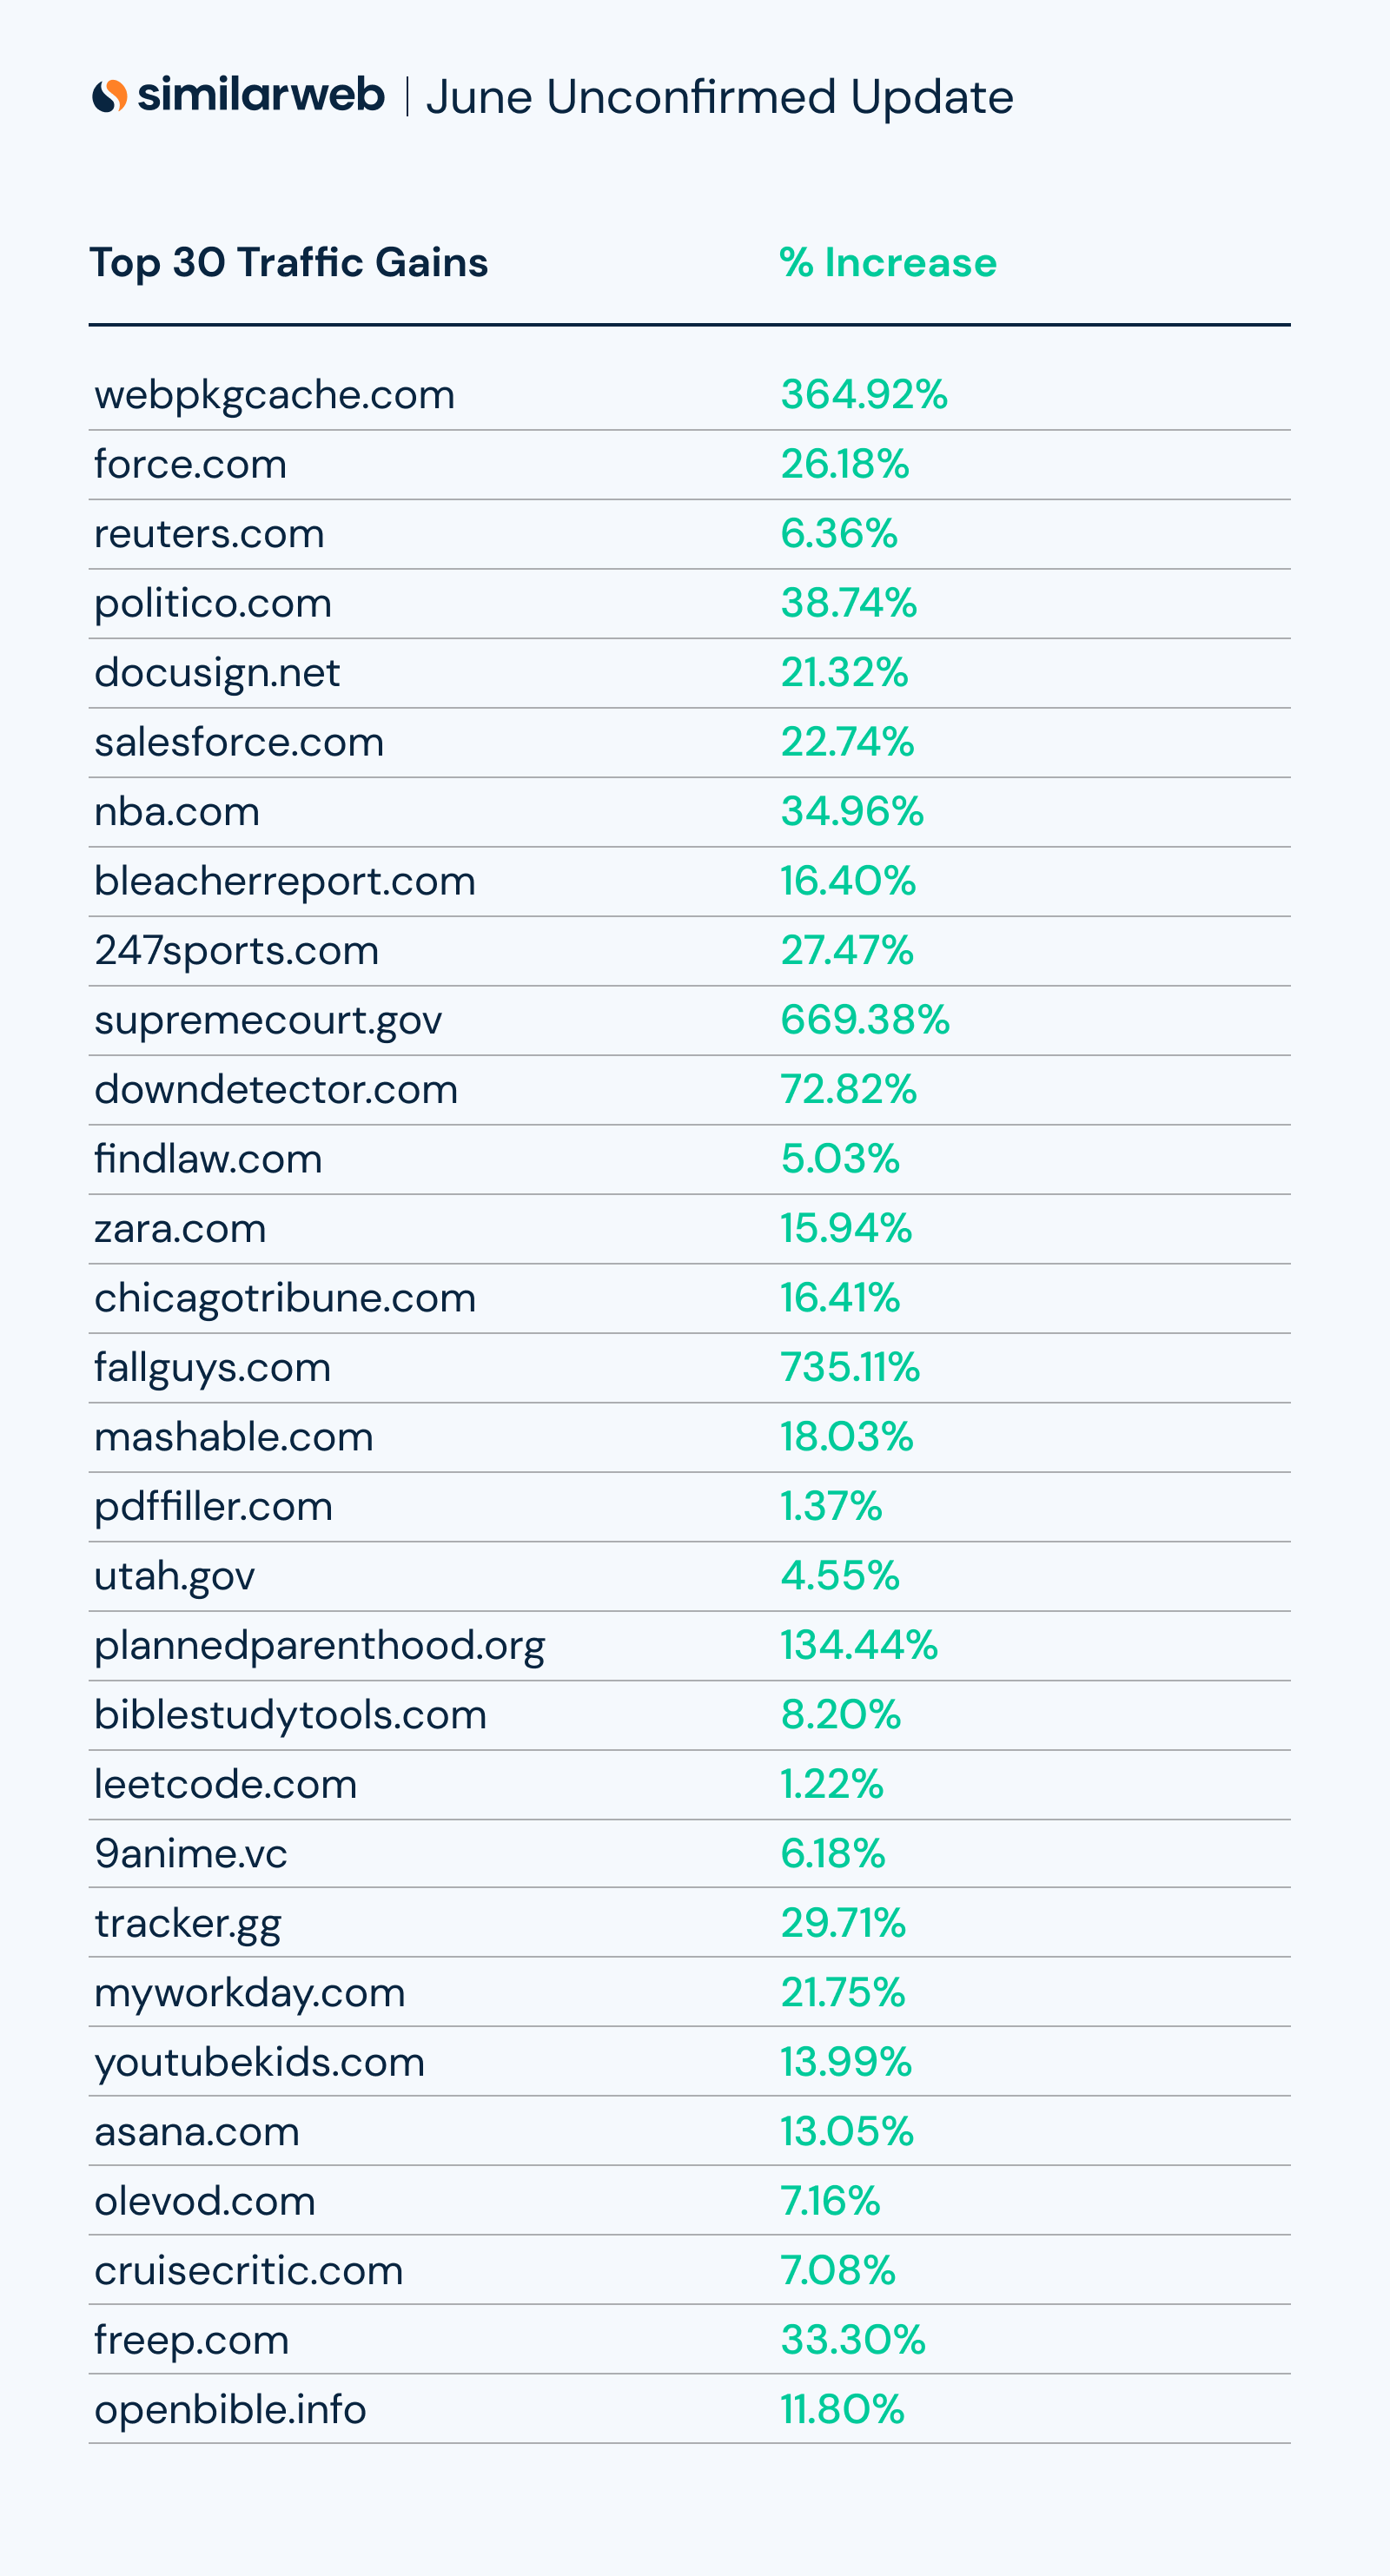
Interesting to note there are some sites that had massive wins during this update.
For instance:
- Webpkgcache.com gained 364% traffic
- Supremecourt.gov gained 669% traffic
- Fallguys.com gained 735% traffic
- Plannedparenthood.com gained 134.44% traffic
Also interesting to note are traffic gains to news sites and political causes.
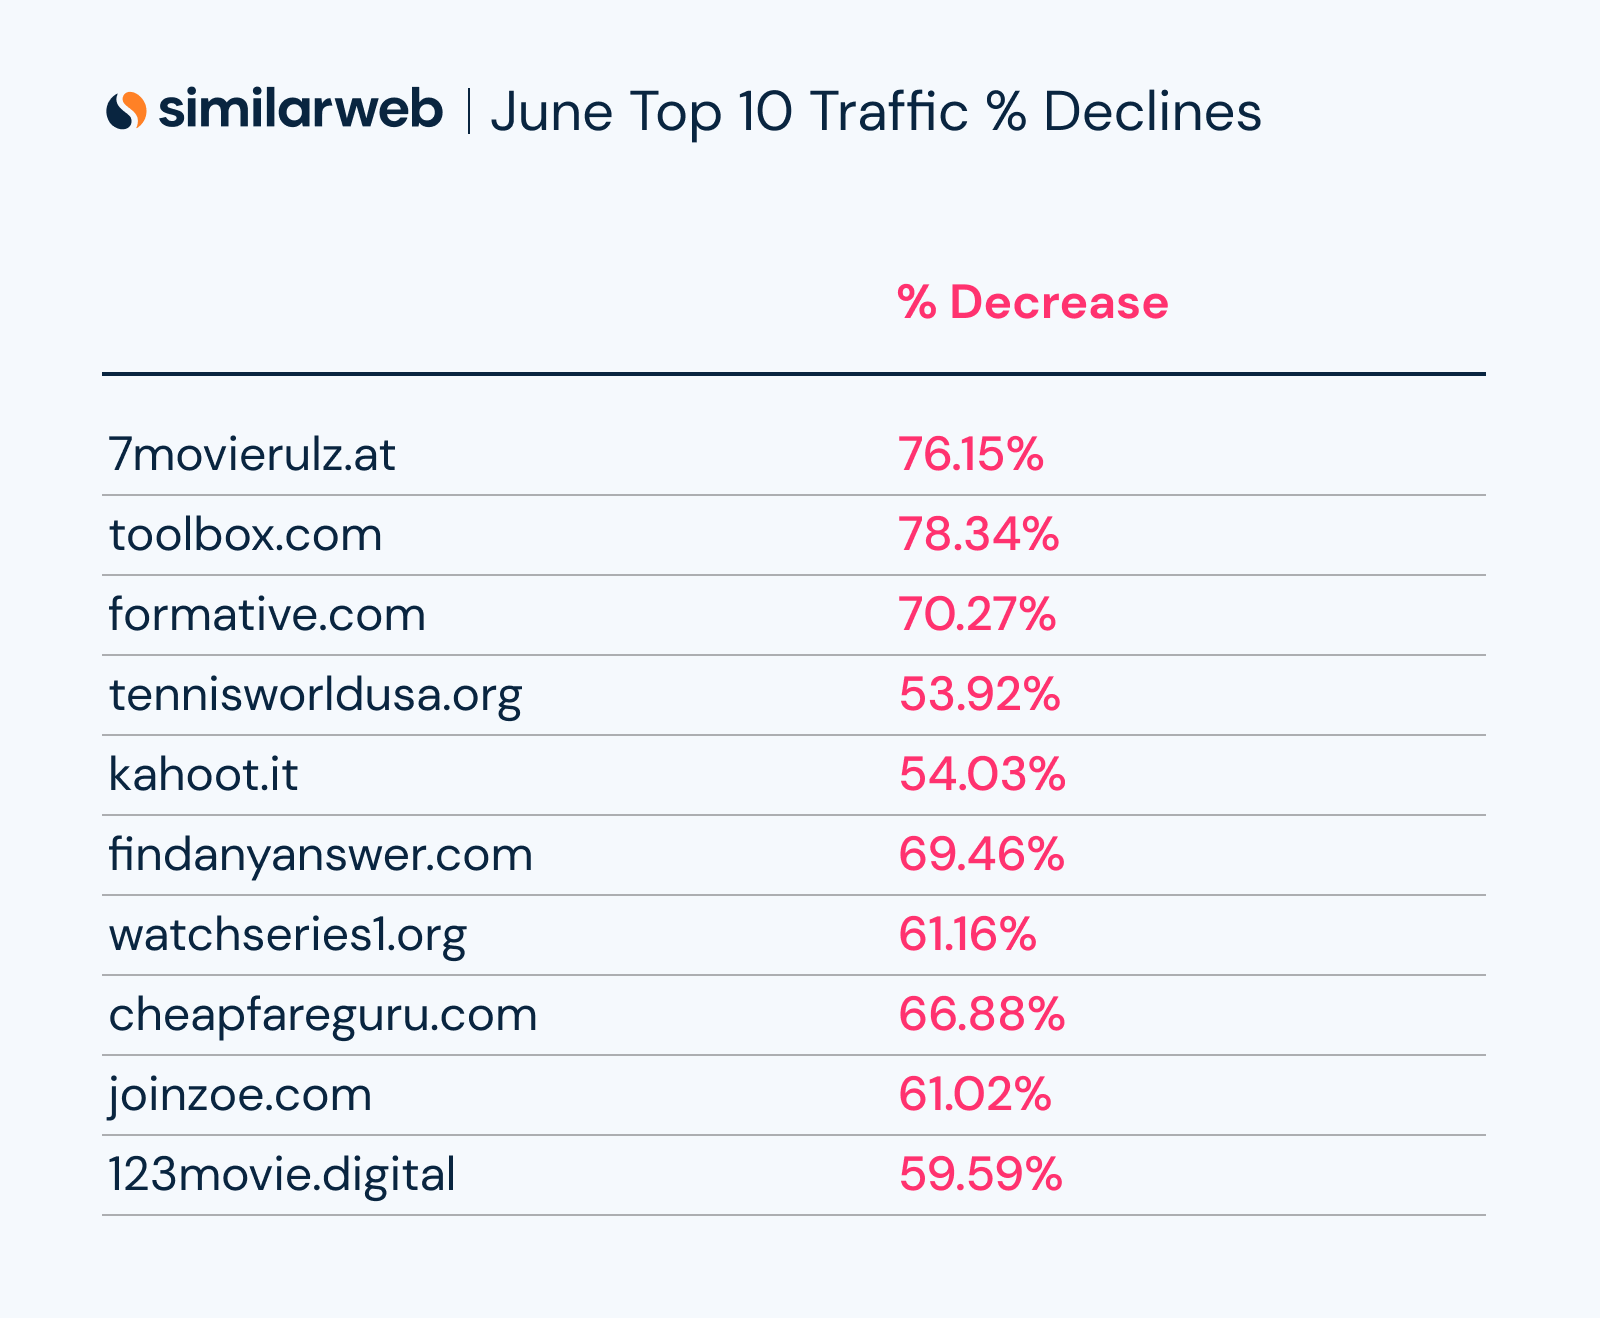
Below are the top 30 sites where traffic declined during the June update.

The first thing that jumps out to me when looking at this list is that some of the sites that had the biggest traffic gains during the May Core update lost traffic during this update.
For instance:
- During May, youtube.com gained 4.02% traffic. In June, Youtube.com lost 6.6% traffic.
- During May, amazon.com gained 4.9% traffic. In June, amazon.com lost 7.35% traffic.
- During May, facebook.com gained 2.14% traffic. In June, facebook.com lost 6.67% traffic
There are many more examples of reversals.
For instance, we saw **** sites gaining during the May update while during the June update **** sites seem to lose traffic.
This leads me to speculate that the June update was a partial reversal of what we saw in May.
What supports this is the June update hit just over two weeks after the May update completed.
Top 10 Traffic Gains and Losses
The data shared below is not based on the sites with the biggest traffic but shows the sites that had the most significant changes to their traffic.
Here are the top ten traffic gains.
Below are the sites that had the biggest traffic declines.
Was the June Update a Reversal of the Core Update?
When looking through the data, I noticed that many of the gains we saw after the May update were reversed during the June update.
Was this a partial reversal by Google?
To support this assumption, we created a new metric that we’ll use in future Google update analyses. We analyzed the top sites on both updates to see if there were any reversals.

Here are all the sites from the top 30 that saw a reversal:
- youtube.com
- amazon.com
- facebook.com
- fandom.com
- ebay.com
- imdb.com
- apple.com
- tripadvisor.com
- xvideos.com
- xnxx.com
- goodreads.com
- tumblr.com
- rottentomatoes.com
Let’s take a look at some of the sites where we are seeing the biggest traffic changes.
Investopedia.com
I noticed that investopedia.com lost around 26% of its traffic during the month of May.
Looking at Similarweb’s Traffic and Engagement metric we see something interesting.
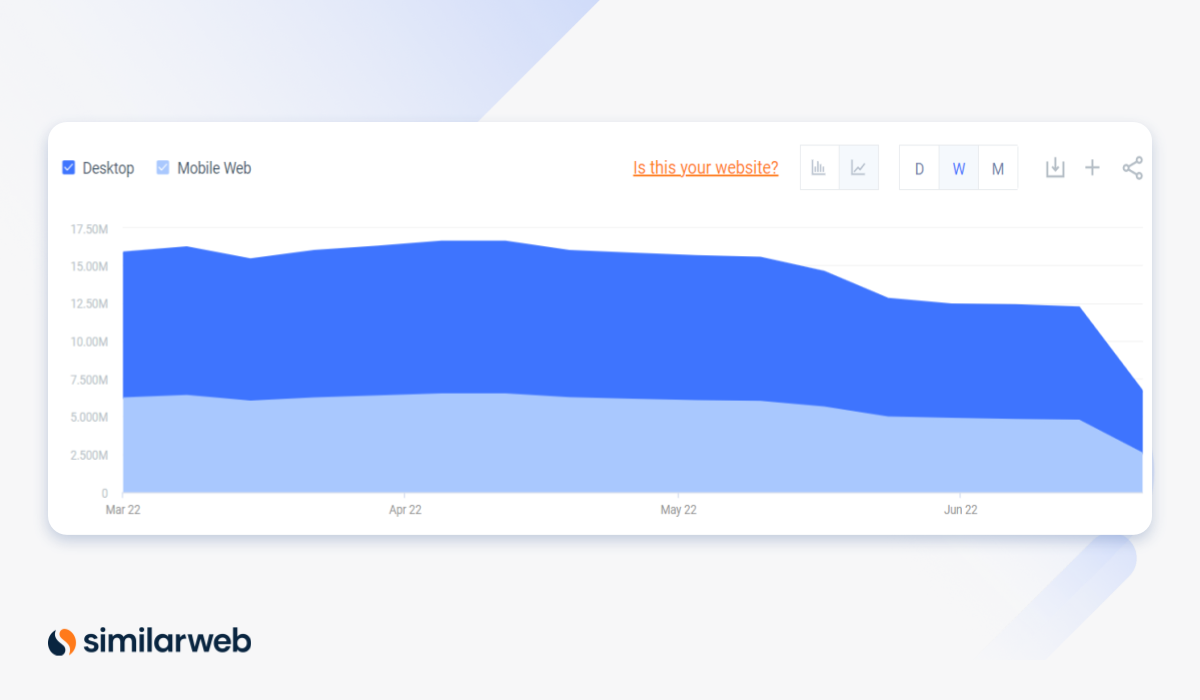
It looks like the site lost traffic the week of an unconfirmed update that happened on May 16th and the downward trajectory continued the week of the May 26th Core Update.
What’s interesting is the site didn’t just lose traffic but also lost 11.02% market share to its competitors.
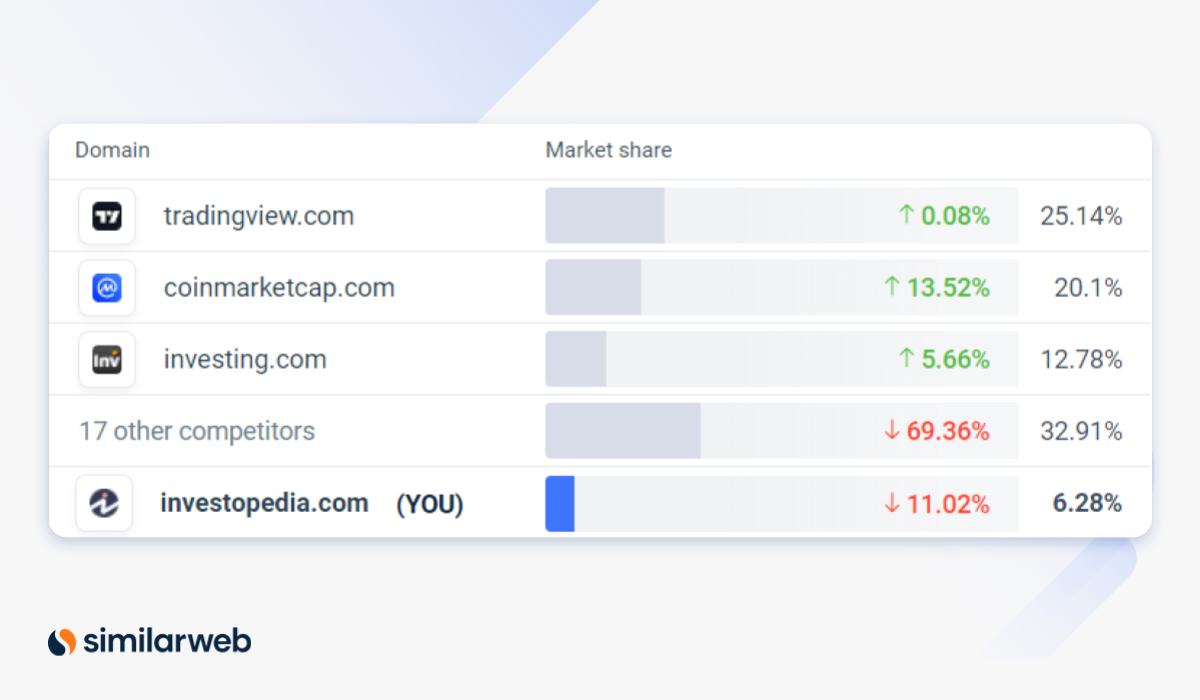
This seems to indicate that it wasn’t just a drop in traffic for the niche itself. There seems to be something about the site that resulted in the drop.
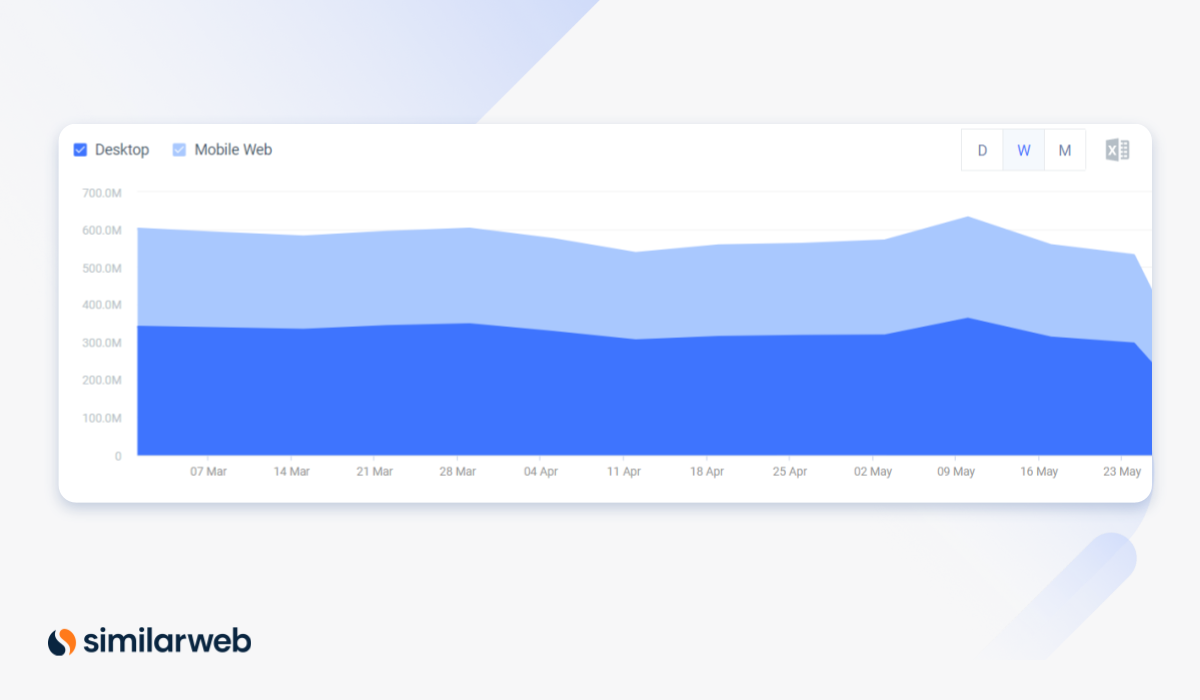
If we look at the investing niche as a whole, you’ll notice that during the May 16th unconfirmed update traffic jumped from 570.3M to 631.3M and then dropped again during the week of the May Core update. What’s interesting is when the traffic for the niche as a whole increased, the site was losing traffic, confirming what we are seeing in the market share data above.
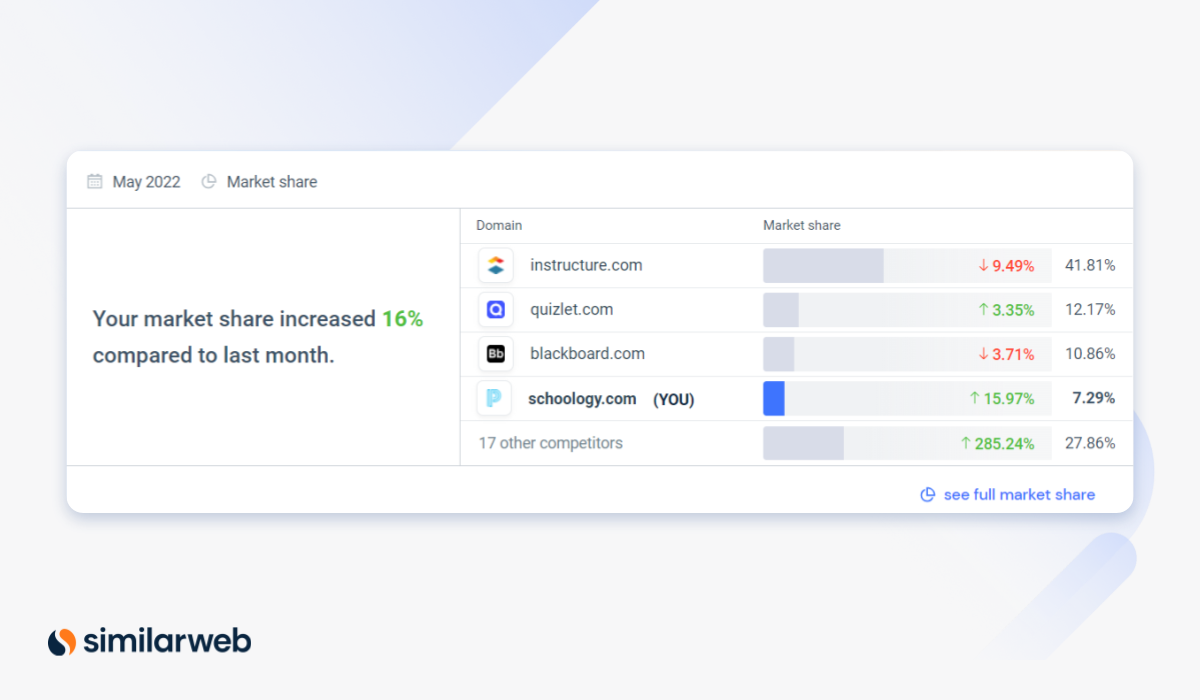
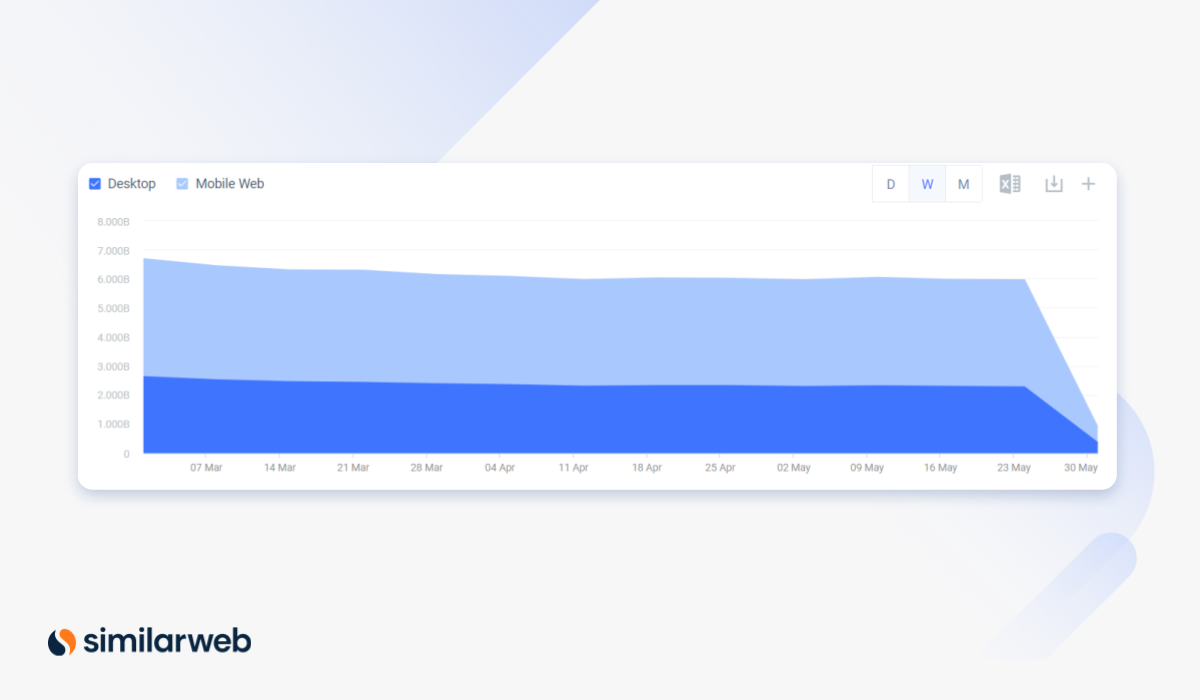
Schoology.com
Looking at schoology.com we see a small drop in traffic starting around the May 16th update. We then saw a massive drop in traffic the week of the May Core Update.
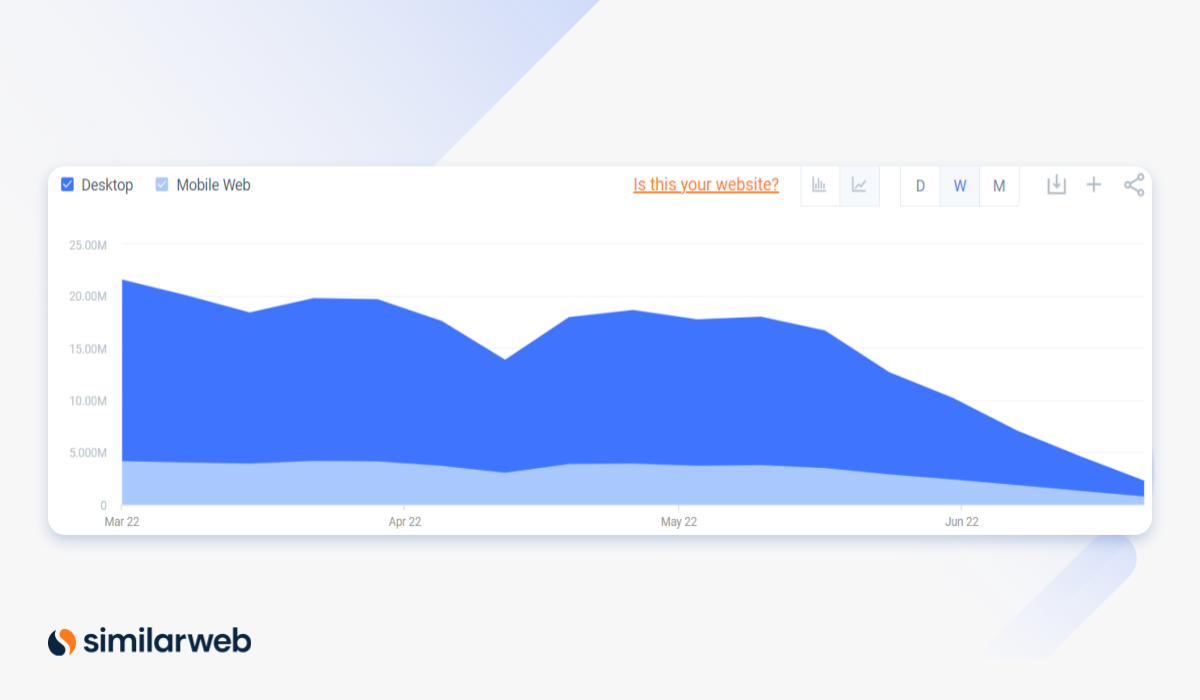
What’s interesting is that even though the site lost major amounts of traffic, when we look at it in comparison to its competitors, it gained market share. This might indicate that the drop in traffic covered the niche as a whole.
If we look at the entire industry, we do see a drop in traffic starting the week of May 17th. Traffic dropped from 1.534B to 1.430B.
What’s more, if we go back to the top 30 traffic drops, you’ll remember that most of the sites that lost traffic were in the educational niche.
Could this drop in traffic account for the drop in Schoology’s traffic?
Difficult to tell.

CBS News
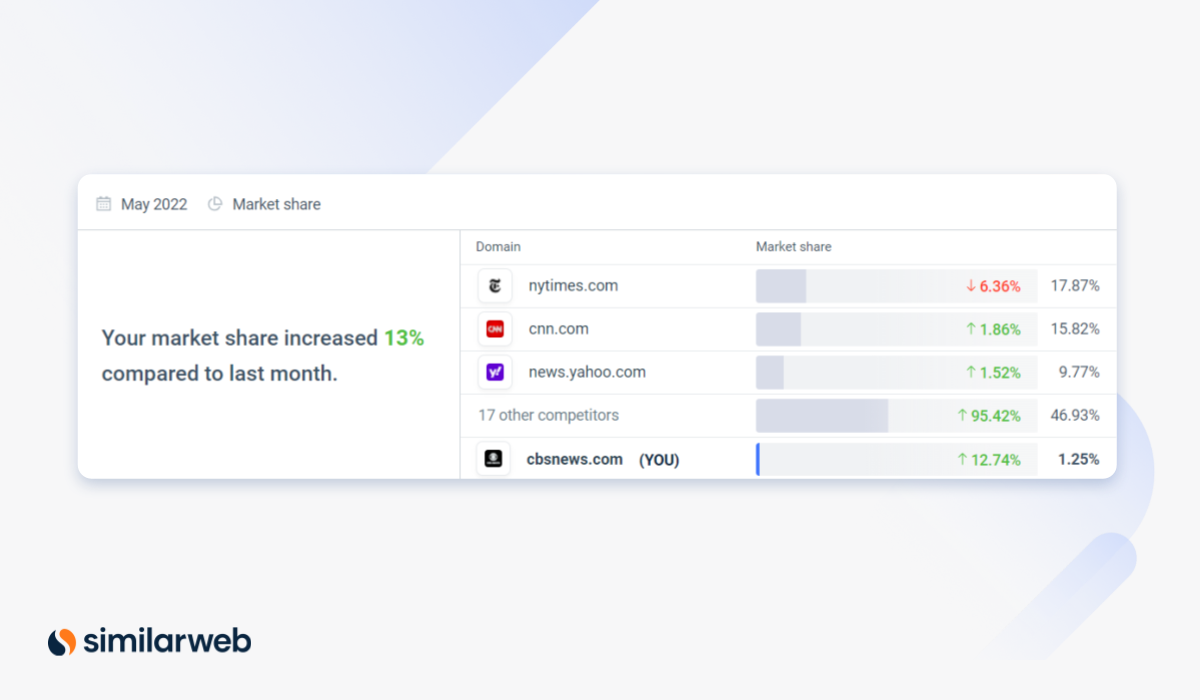
During the week of the May Core update, traffic for CBS News spiked and then began to decline. Was the drop in traffic a correction on Google’s part?

Competitive data for April and May shows the site gaining market share. This echoes what we are seeing in the site’s organic traffic data.
If we look at the News and Media niche as a whole we see that there has been a gradual decrease in traffic for the months of March through May.
This certainly doesn’t account for the spike in traffic that CBS News enjoyed during the May Core update.
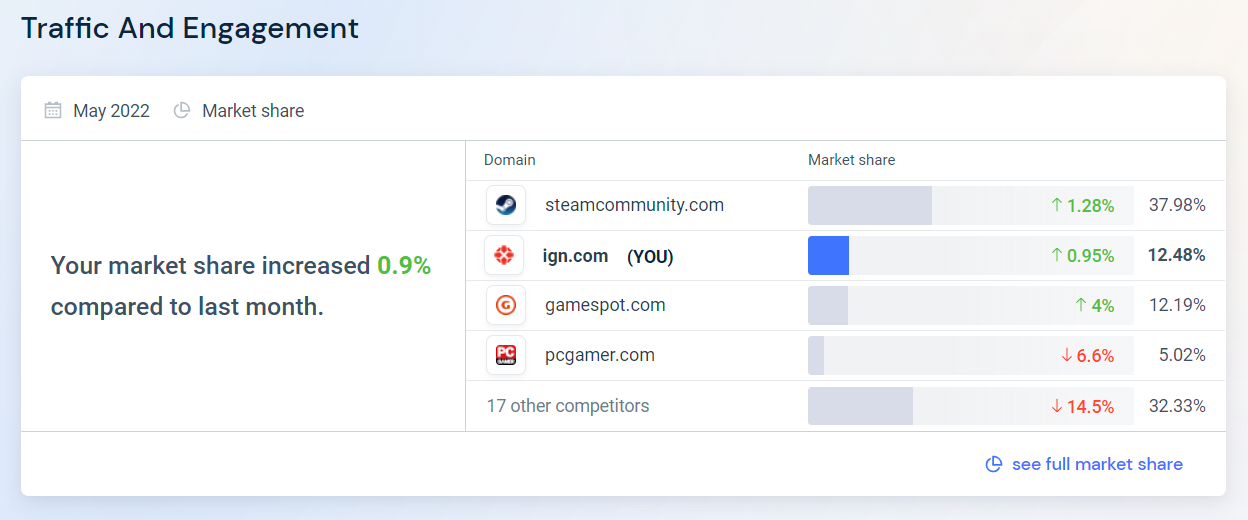
Ign.com
IGN was an obvious winner. As you can see in the screenshot below, around the week of the May update, IGN began to gain traffic.

We are also seeing the site’s market share increase slightly.
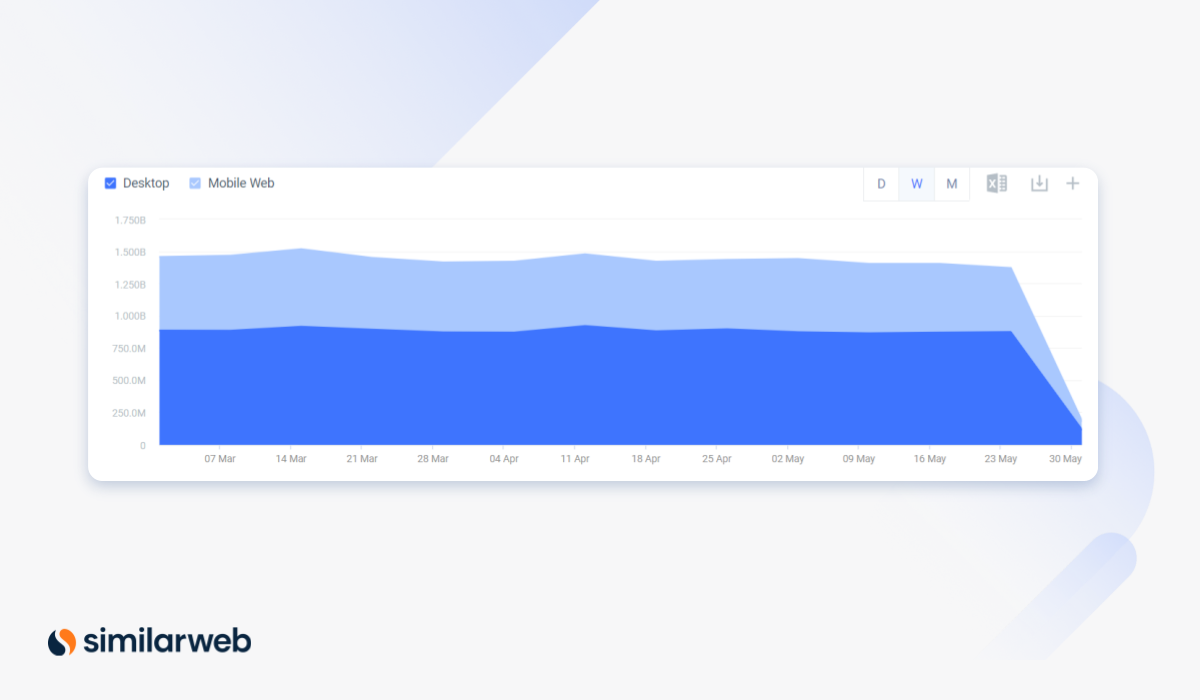
Looking at the video game accessories niche as a whole, we are seeing traffic decreasing over time.
Okay, so we are seeing some obvious traffic and ranking changes this month. But, to get a better understanding of how Google Search has changed, it really pays to keep an eye on any SERP feature changes.
This is what I found.
SERP Feature Changes
We’ve seen in the past that Google often changes the layout of the SERPs by changing its various SERP features. It’s not clear to me whether these changes are based on the updates or not. I still feel it makes sense to report the changes.
I took a look through our SERP feature tools to see if I could see anything obvious.
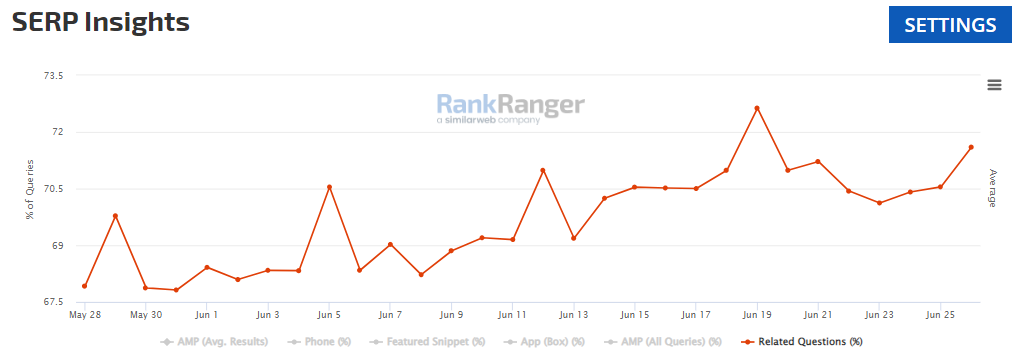
Related Questions (PAA Box)
The first thing that caught my eye was the People Also Ask feature. What we are seeing is an increase in People Also Ask boxes on both mobile and desktop.
This is good news for SEOs as the People Also Ask boxes offers an opportunity to have content featured on competitive SERPs.
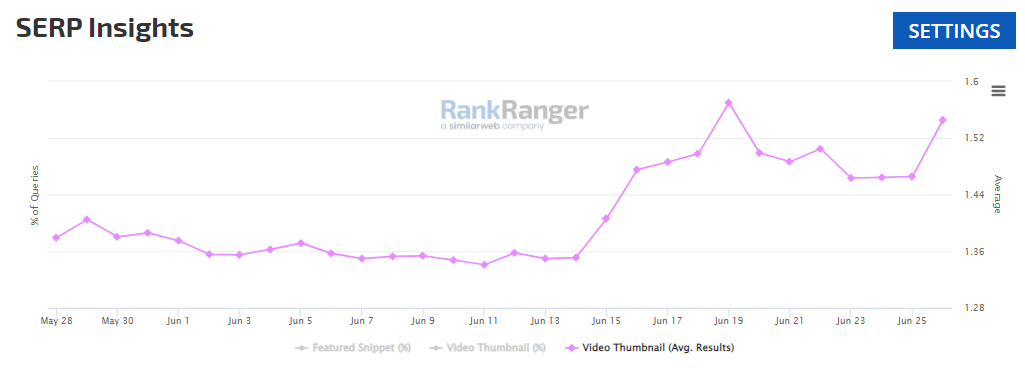
Video Thumbnails
We are seeing an upward trend in Video Thumbnails on both mobile and desktop.
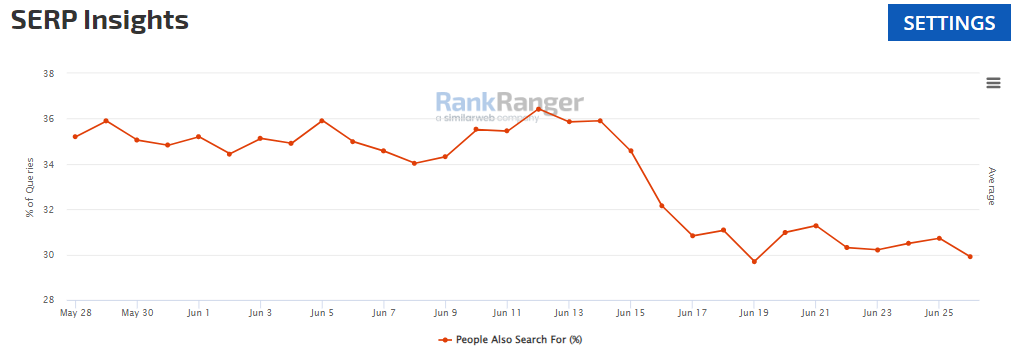
People Also Search For
We are seeing a drop in Related Searches (People Also Search For) on mobile.
The Big Picture – Were the Updates Connected?
Reflecting on the data, I’m sure you are wondering if there was a connection between the two updates.
Again, it’s important to remember that all we can do is speculate.
That said, here is the evidence:
The June update hit around two weeks after the May update. Although not unheard of, this does indicate that the June update was at least unusual. Based on this alone I wouldn’t speculate too much.
But, we also saw from the data that the June update burned white-*** with the same intensity of the December 2021 update. Again, not concrete evidence, but perhaps evidence that Google was changing its broader algorithms the same way it does for a core update.
Finally, we saw almost half of the top 30 winners from the May update lose those wins in June. What’s more, we saw a 3.57% reversal across the internet.
Putting the pieces together, I’d suggest there is certainly evidence that they were connected. What’s more, the June update did look like a partial reversal of the May update.
About The Author