Google Business Profile (GBP) performance metrics are an important piece of the local reporting puzzle. There’s great value in evaluating these insights not only for each of your locations but across your brand as a whole. We pull the cover back further by releasing trends and insights gleaned from our analysis of over 230,000+ enterprise business locations across eight types of business.
In this past quarter, we saw a continuation of the hotel industry’s recovery and increased search interest for restaurants. The news wasn’t as good for enterprise retailers, who experienced dramatic declines in average search views and conversion actions per location.
What are you seeing in your brand’s local search performance metrics? In this article, we share high-level trends from our internal research to help brands understand the connection between GBP metrics and customer experience (CX), with industry trends that help give these figures context.
Recent updates to how enterprise local search benchmarks are calculated
From late 2020 to December 2022, our team aggregated and analyzed GBP performance data from over 230,000+ enterprise brand locations (with 50+ locations) on a monthly basis and shared local consumer search trends on our blog. This year, we transitioned to quarterly reporting, making this our second quarterly insights edition.
Google updated how view metrics are calculated for brands in February 2023, so only unique views are tracked (versus counting every instance of a user viewing a Profile). This means that if the same searcher views a brand’s Google Business Profile four times in one day, it now counts as a single view. Remember this to give context to reductions you may see in Total Views.
Another impactful change recently was the removal of Total Search metrics and the breakout of search queries by Direct, Brand, and Discovery. Instead, GBP now tracks:
- Impressions – Maps – Desktop
- Impressions – Maps – Mobile
- Impressions – Search – Desktop
- Impressions – Search – Mobile
We’ve combined these into a Total Impressions metric that replaces Searches in our benchmark reporting. All figures in our benchmark reporting have been normalized to represent average change per location.
Business services
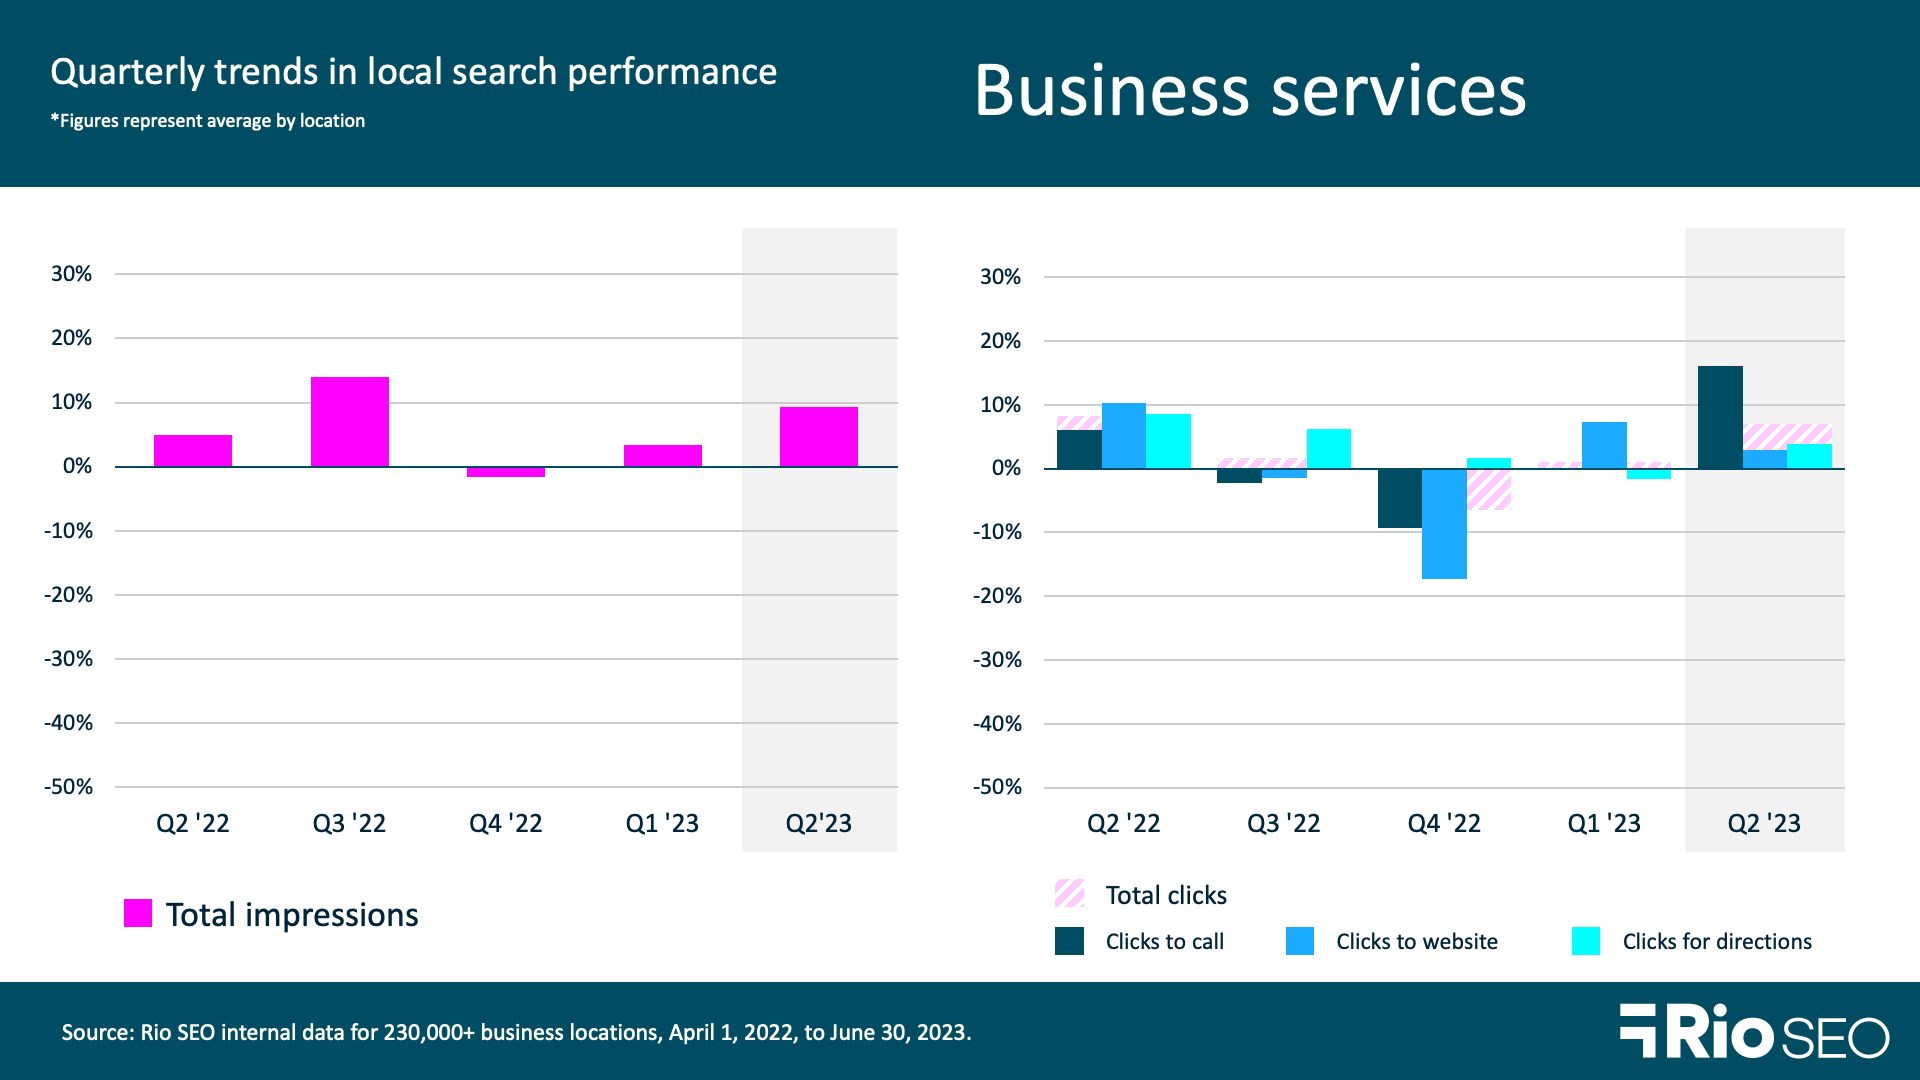
- Total impressions rose +9.3% QoQ and +26.7% YoY in Q2 2023.
- Total clicks rose +7.03% QoQ and +2.9% YoY in Q2 2023.
Business services brands saw a slight rebound in Search Views with a 9.3% increase, after losing 43.6% in Q1. For the purposes of this research, this segment includes postal and delivery services, storage facilities, fitness studios, IT companies, personal care services, and a variety of other businesses. The impacts of a labor shortage, inflation, and rising unit labor costs are ongoing for many businesses in this sector.
Whether consumers search via maps applications, GPS systems, voice assistants, or smartphones, accurate and complete search listings are essential. Local listings management ensures your customers are met with the information they need to convert to an in-store visit when and where they’re looking for businesses like yours. And when you’re trying to maintain consistency across hundreds or thousands of business locations, you need purpose-built technology in place to monitor for inconsistencies and push your local data to local directories, applications, and platforms.
Financial services
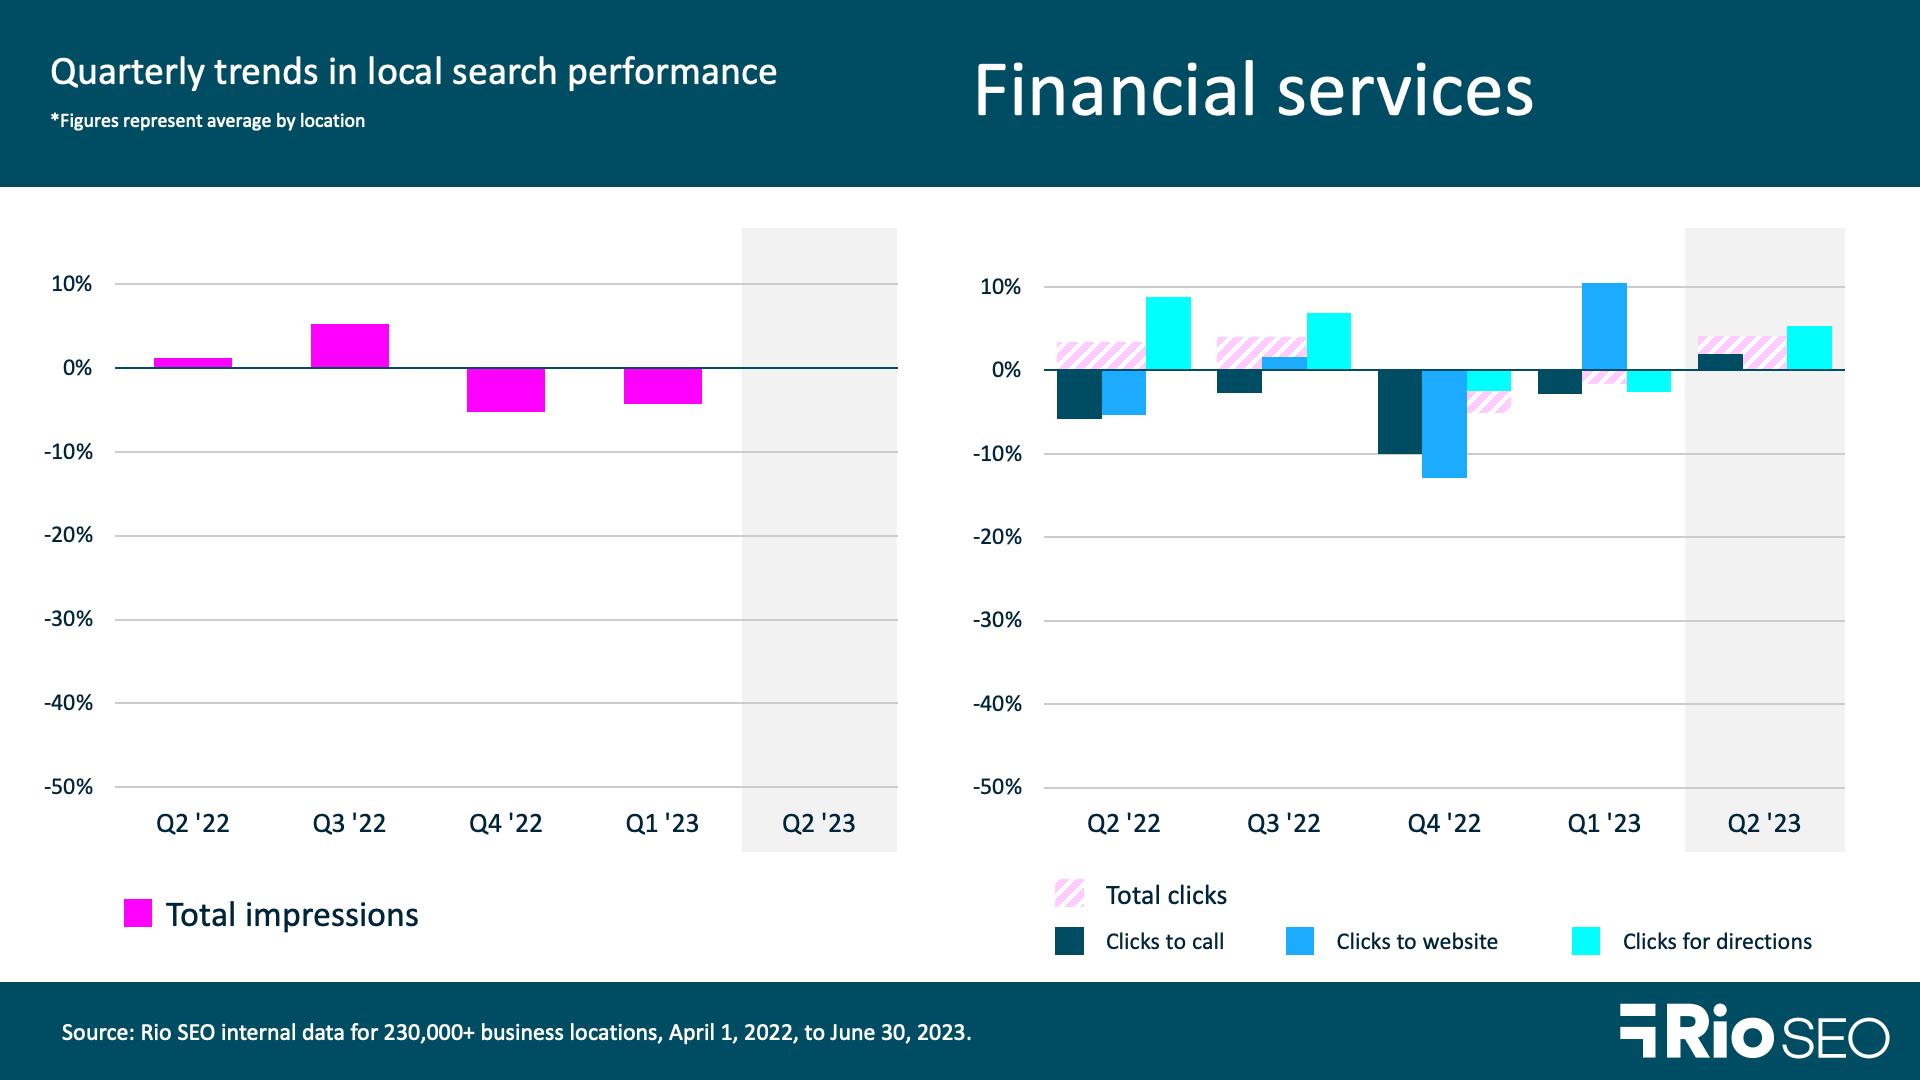
- Total Q2 2023 impressions: +0.03% QoQ and -4.57% YoY
- Total Q2 2023 clicks: +4.11% QoQ and +1.08% YoY
Financial services brands including banks, insurance companies and agents, investment firms, and other types of financial institutions saw little quarterly movement in total impressions and a slight decline in clicks. On a yearly basis, impressions dropped slightly, while conversion actions as measured by clicks were flat.
Inflation has had a major impact on markets over the last several months. As Black Rock explains, various supply constraints mean the U.S. cannot produce as much without fueling higher inflation. JP Morgan predicts inflation will cool slightly but remain above 3% for the foreseeable future, and that we’re headed for a global recession before the end of 2024.
In challenging financial times, consumers seek information and assistance from the professionals and organizations they trust. That trust is hard won and easily lost online, where misinformation by way of inaccurate or outdated business data can result in negative experiences for local customers. Financial services brands can use Google Posts to share important information and offers for consumers. However, this is one industry where it’s particularly important to have a process for removing Posts once they become outdated, to avoid misunderstandings (or worse, false advertising).
It’s also critical that financial services brands stay attuned to changing consumer needs and preferences. This is no small feat at the enterprise level, where millions of conversations may be happening across countless platforms. How can you tune into so many voices to not only collect this data but convert it to actionable insights? Read Virgin Money’s story here and see how they raised NPS scores from +51 to +64 while increasing profit 33% with a dedicated Voice of Customer (VOC) program.
Full-service restaurants
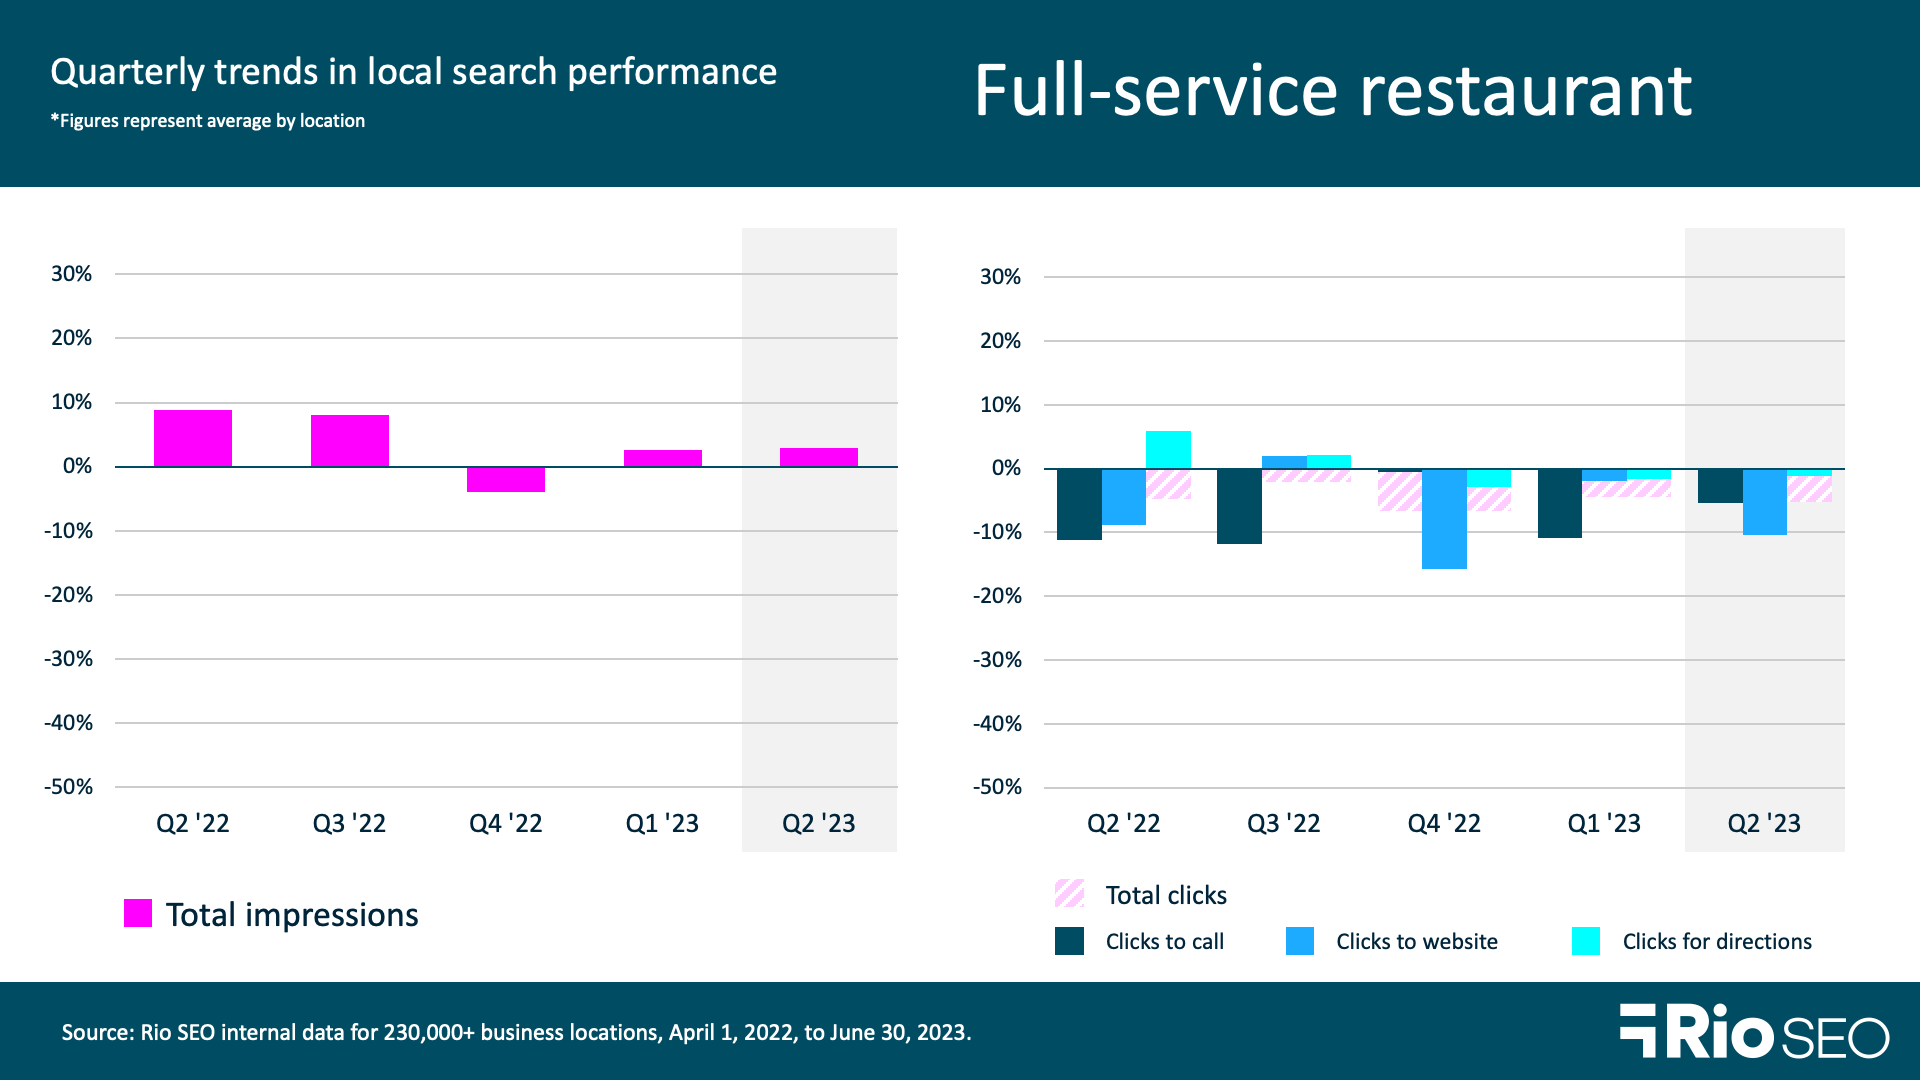
- Total Q2 2023 impressions: +3% QoQ and +9.6% YoY
- Total Q2 2023 clicks: -5.24% QoQ and -17.6% YoY
- Q2 2023 Food Menu -47.09%% QoQ and -53.71YoY
- Q2 2023 Bookings: -26.1% QoQ and -33.9% YoY
- Q2 2023 Food order clicks: -29.1% QoQ and -29.8% YoY
Full-service restaurants continued their COVID-related business recovery with 9.6% higher Q2 search impressions than in 2022. Total clicks fell 5% from Q1 and are down 17.26% from the same time last year. However, this is no cause for alarm, as local customers’ informational needs were higher in 2022 when waves of pandemic-related business interruptions meant more people sought out information about business hours and closures by calling ahead to restaurants or looking for information on their websites.
GuestXM (formerly Black Box Intelligence) reports that June was a good month for restaurants, with same-store sales and traffic growth at their highest levels since March. U.S. restaurants posted stronger YoY sales in May and June, although they caution that optimism should be tempered by declining guest counts.
Giving hungry diners options to convert to a reservation directly from search is essential in the hypercompetitive dine-in restaurant space. Google gives restaurants a way to streamline the customer experience from search to booking via Reserve with Google, a feature that enables customers to book or join a reservation waitlist directly on the restaurant’s business listing. Learn more about Reserve with Google here.
Quick-service restaurants
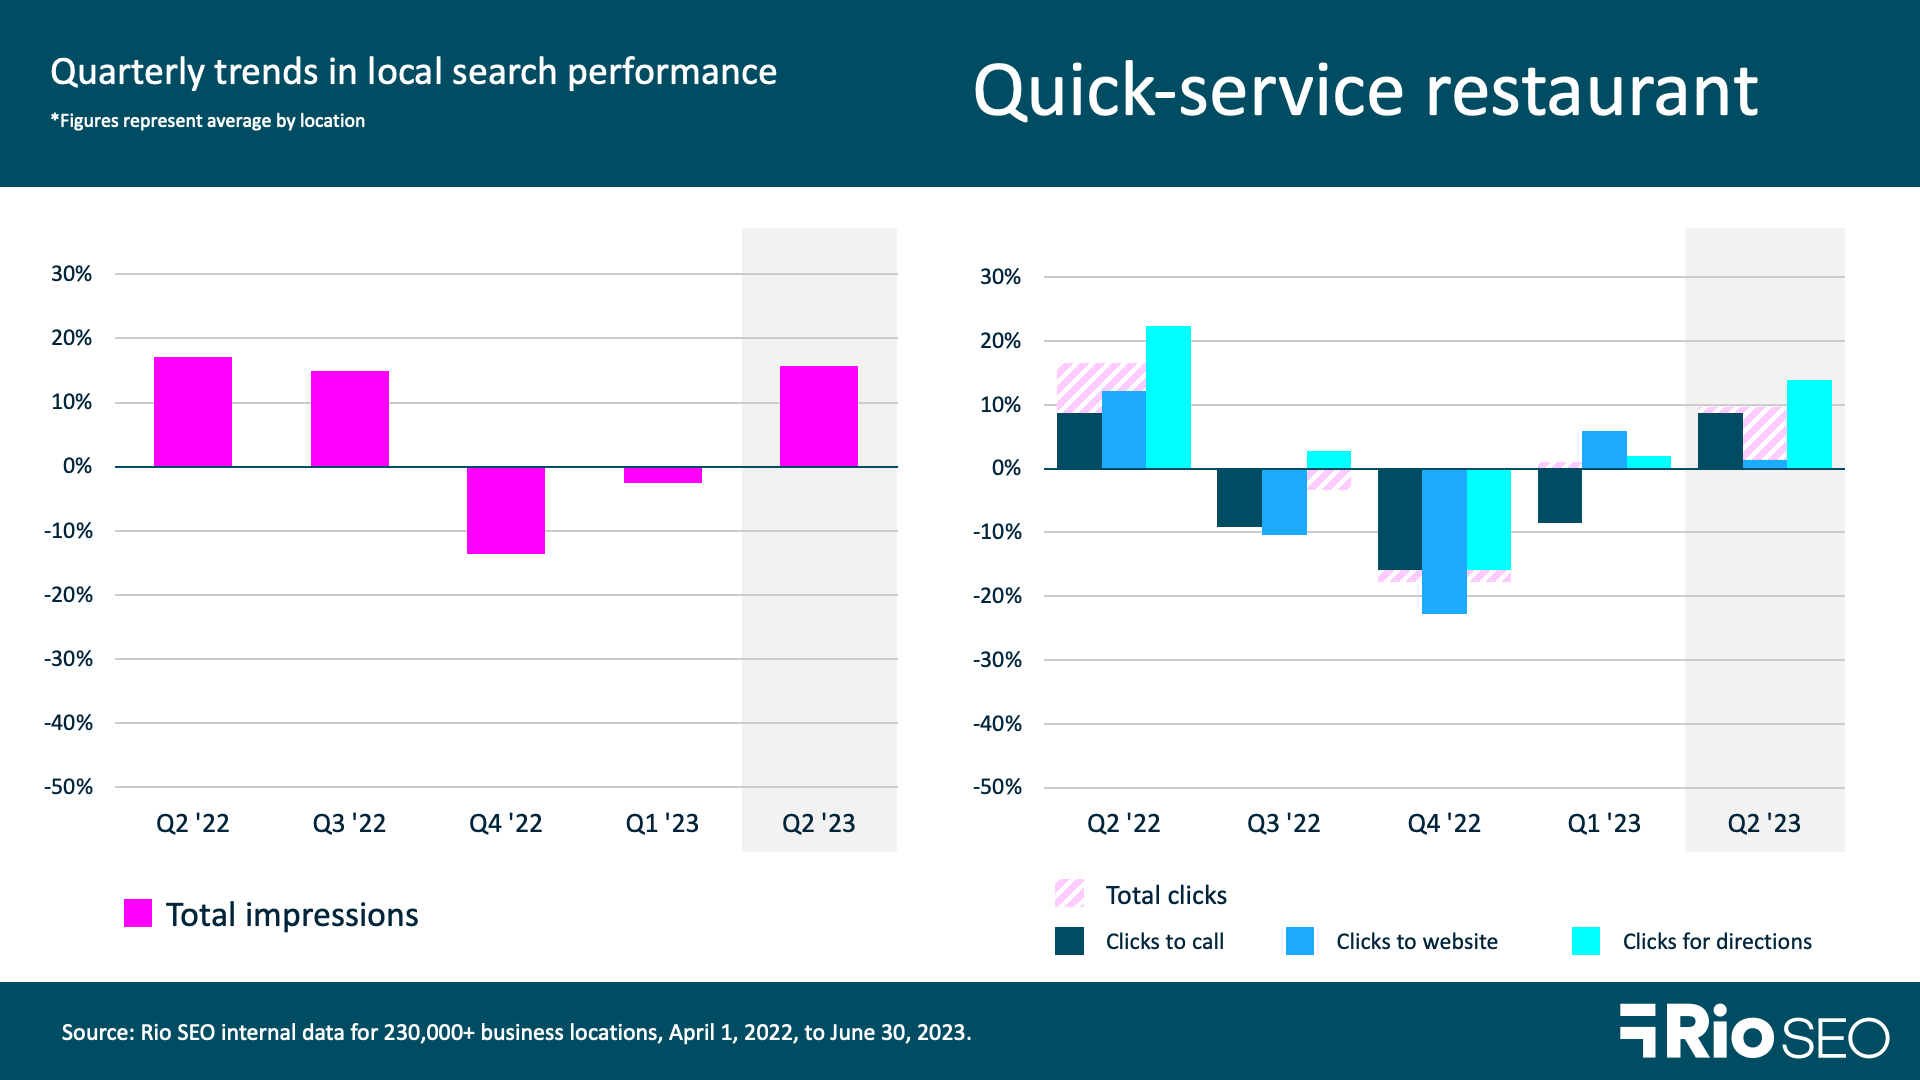
- Total Q2 2023 impressions: +15.8% QoQ and +12.1% YoY
- Total Q2 2023 clicks: +9.7% QoQ and -11.94% YoY
- Q2 2023 food orders: +9.1% QoQ and 0% YoY
- Q2 2023 food menu clicks: -33.46% QoQ and -55.16% YoY
Quick service restaurants saw the same trend as their full-service counterparts, with 15.8% greater impressions QoQ and 12.1% more YoY. Food orders rose 9.1% this quarter over last, highlighting the importance of this business listing feature.
Enterprise brands can add menu attributes to listings in a structured way using the GBP FoodMenus API. You can also make corrections to inaccurate menu item names, which occur naturally as well-intentioned customers make honest mistakes when sharing their restaurant experiences online.
Using all available attributes on each location’s GBP is another way to differentiate your restaurants from the competition, especially in competitive markets. Google assigns different types of attributes by business category, giving restaurants the option to highlight services and traits such as curbside pickup, order ahead, certified kosher food, local ingredients, and a lot more. Check out the list of GBP restaurant attributes here.
Hotels
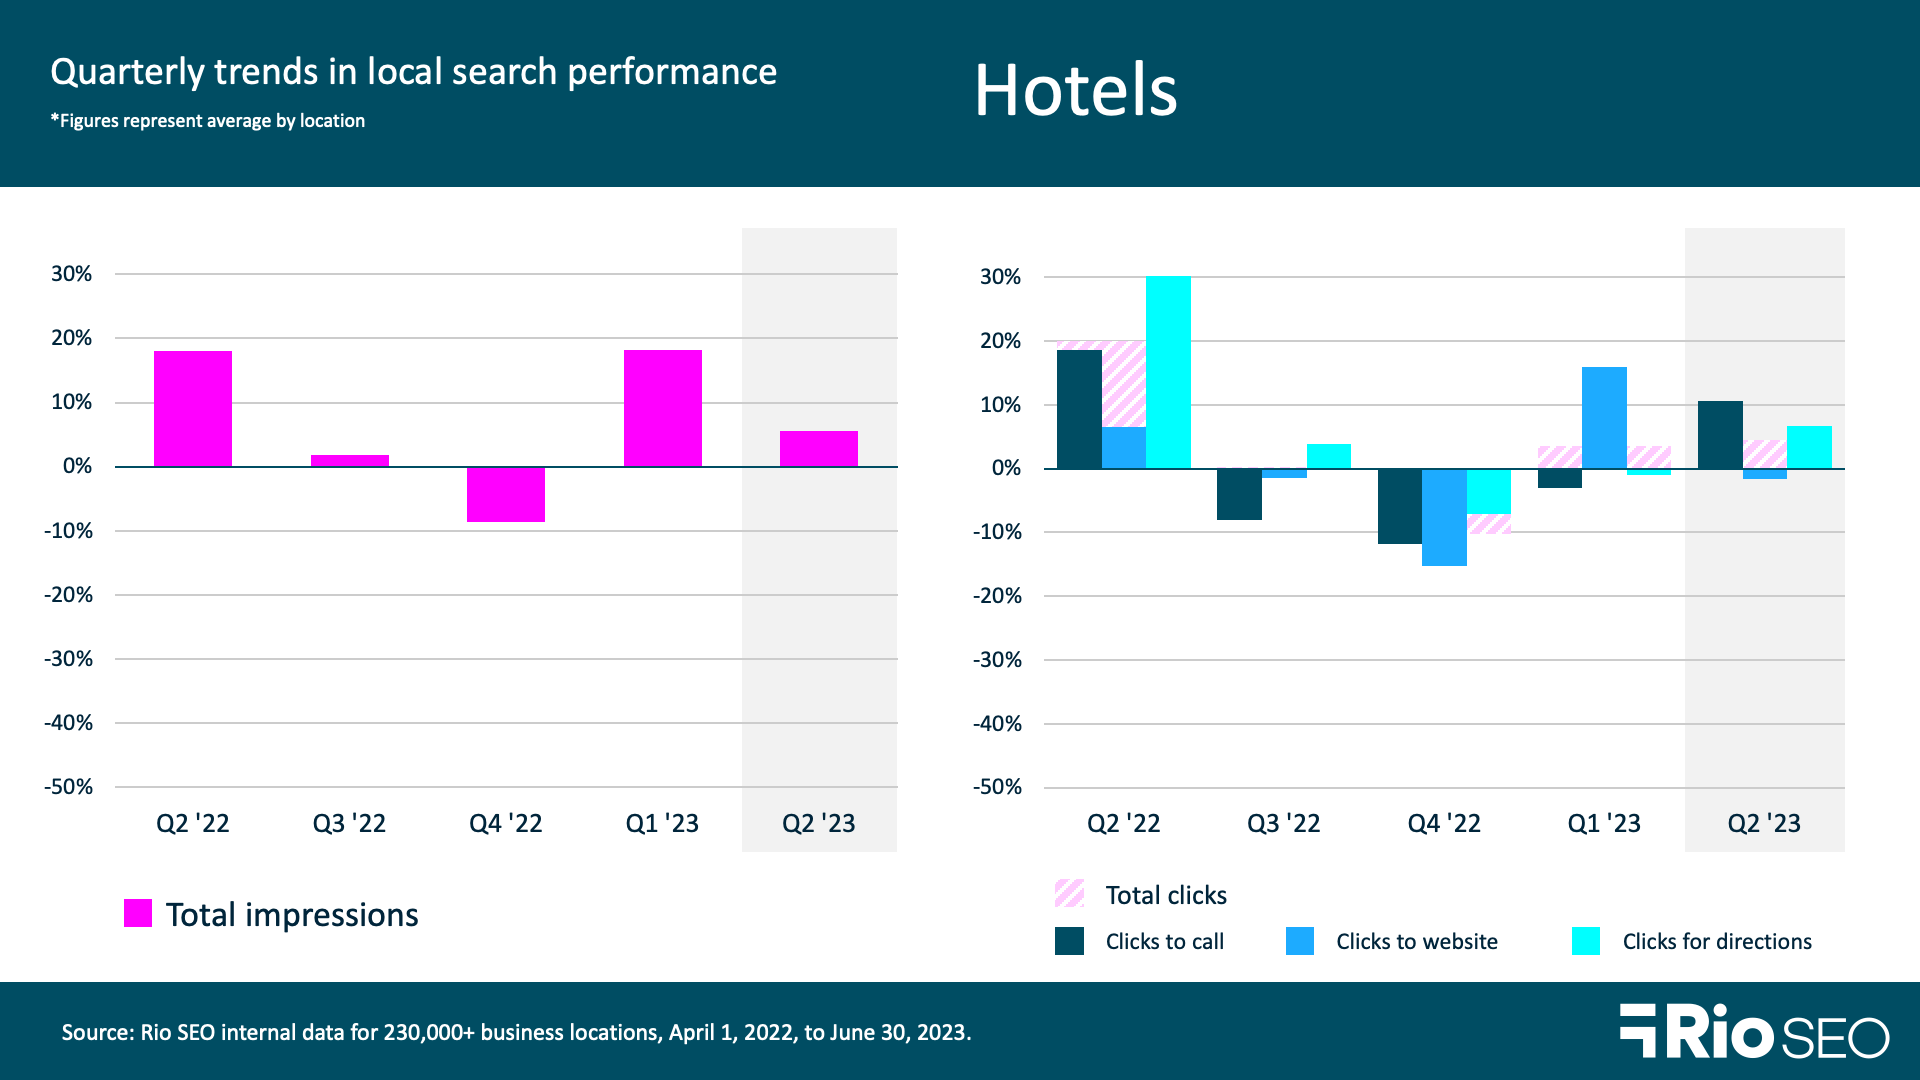
- Total Q2 2023 impressions: +5.6% QoQ and +16.01% YoY
- Total Q2 2023 clicks: +4.54% QoQ and -2.56% YoY
- Q2 2023 bookings: -14.78% QoQ and -9.25 YoY
Hotel brands had a good Q2 in search, with average increases of 5.6% QoQ and 16% YoY in search impressions per location. Bookings through GBP decreased by -15% from Q1.
While some trips are planned months or even years in advance, many hotel bookings are made on the spur of the moment. How your hotels present in search can make the difference between a booking or a missed opportunity. Take advantage of every field available in each location’s Google Business Profile. According to Google, customers are 70% more likely to visit and 50% more likely to consider purchasing from businesses with a complete Business Profile.
For hotels, this means using attributes, sharing Posts, and enticing travelers to visit with professional, high-quality photos. It means keeping listings up to **** with ongoing monitoring and uniform updates when new information is released. Having a strategy for highlighting property amenities and services such as a spa facility or event space is key, too. Get the ‘Guide to Google Business Profiles for hospitality brands’ to learn more.
Retail
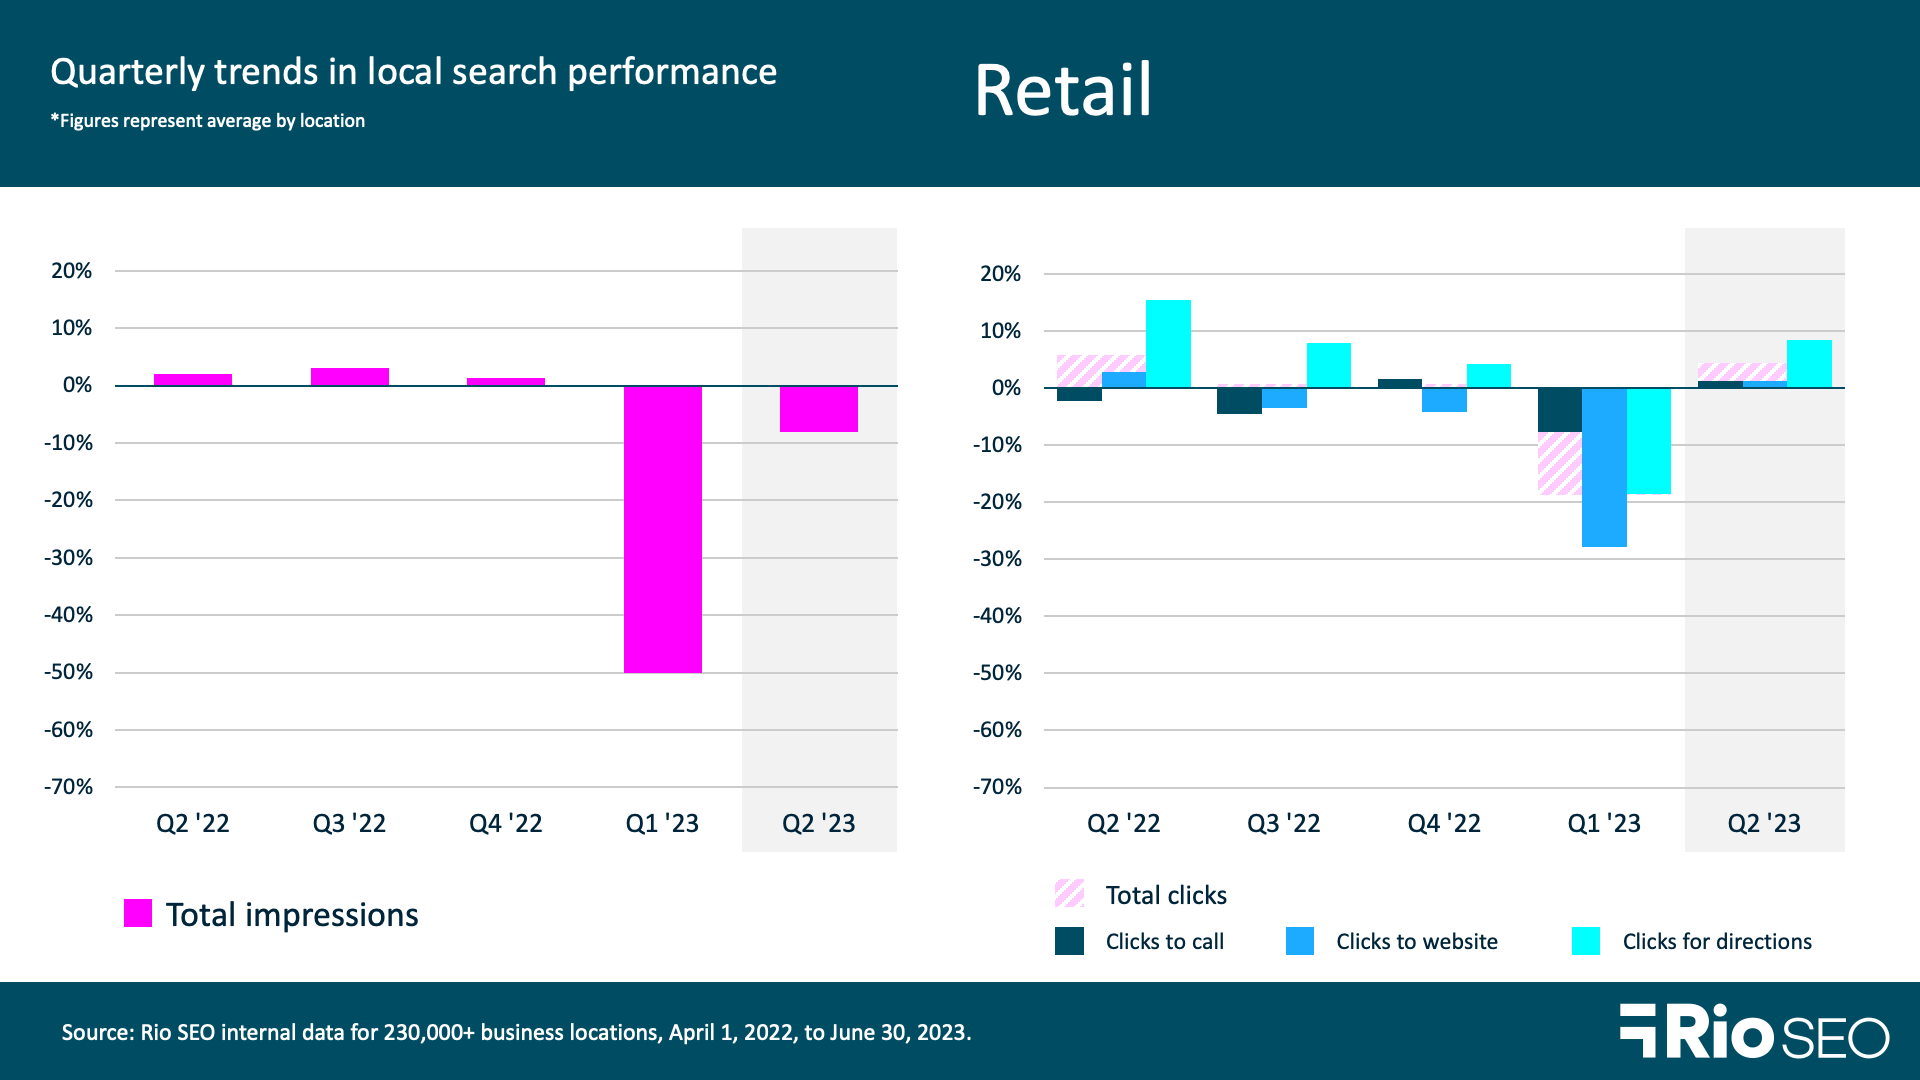
- Total Q2 2023 impressions: -8.1% QoQ and -52.1% YoY
- Total Q2 2023 clicks: +4.32% QoQ and -14.20% YoY
Like financial services brands, retailers are feeling the pressure of inflation and consumer fears of an impending global recession. Impressions fell 8.1% from Q1 and were down a staggering 52.1% from Q2 2022. We see this impact mirrored in YoY clicks to conversion actions, which were down -72.5%
Higher food prices and housing expenses are driving reduced discretionary spending, and retailers are seeing the impact in real terms. Seeking Alpha reports that the LSEG U.S. Retail and Restaurant Q2 earnings index, which tracks changes in the growth rate of earnings within the sector, is expected to show 17.6% YoY growth. However, six of the 10 consumer-related segments tracked have turned negative, with the following hit the hardest:
- Leisure products (-25.6%)
- Textiles, apparel, and luxury goods (-23.1%)
- Personal care products (-21.9%)
Meanwhile, the U.S. Census Bureau reports that U.S. retail e-commerce sales rose just 2.1% over Q1, failing to keep pace with inflation.
Retail brands can tap into up-to-**** customer concerns and preferences with online surveys, the results of which provide powerful voice of customer insights to fuel smart marketing strategy. Collect survey data around brand awareness, customer satisfaction and loyalty, and competitor sentiment at regular intervals to establish internal benchmarks you can use to make incremental improvements, no matter the economic outlook.
Healthcare
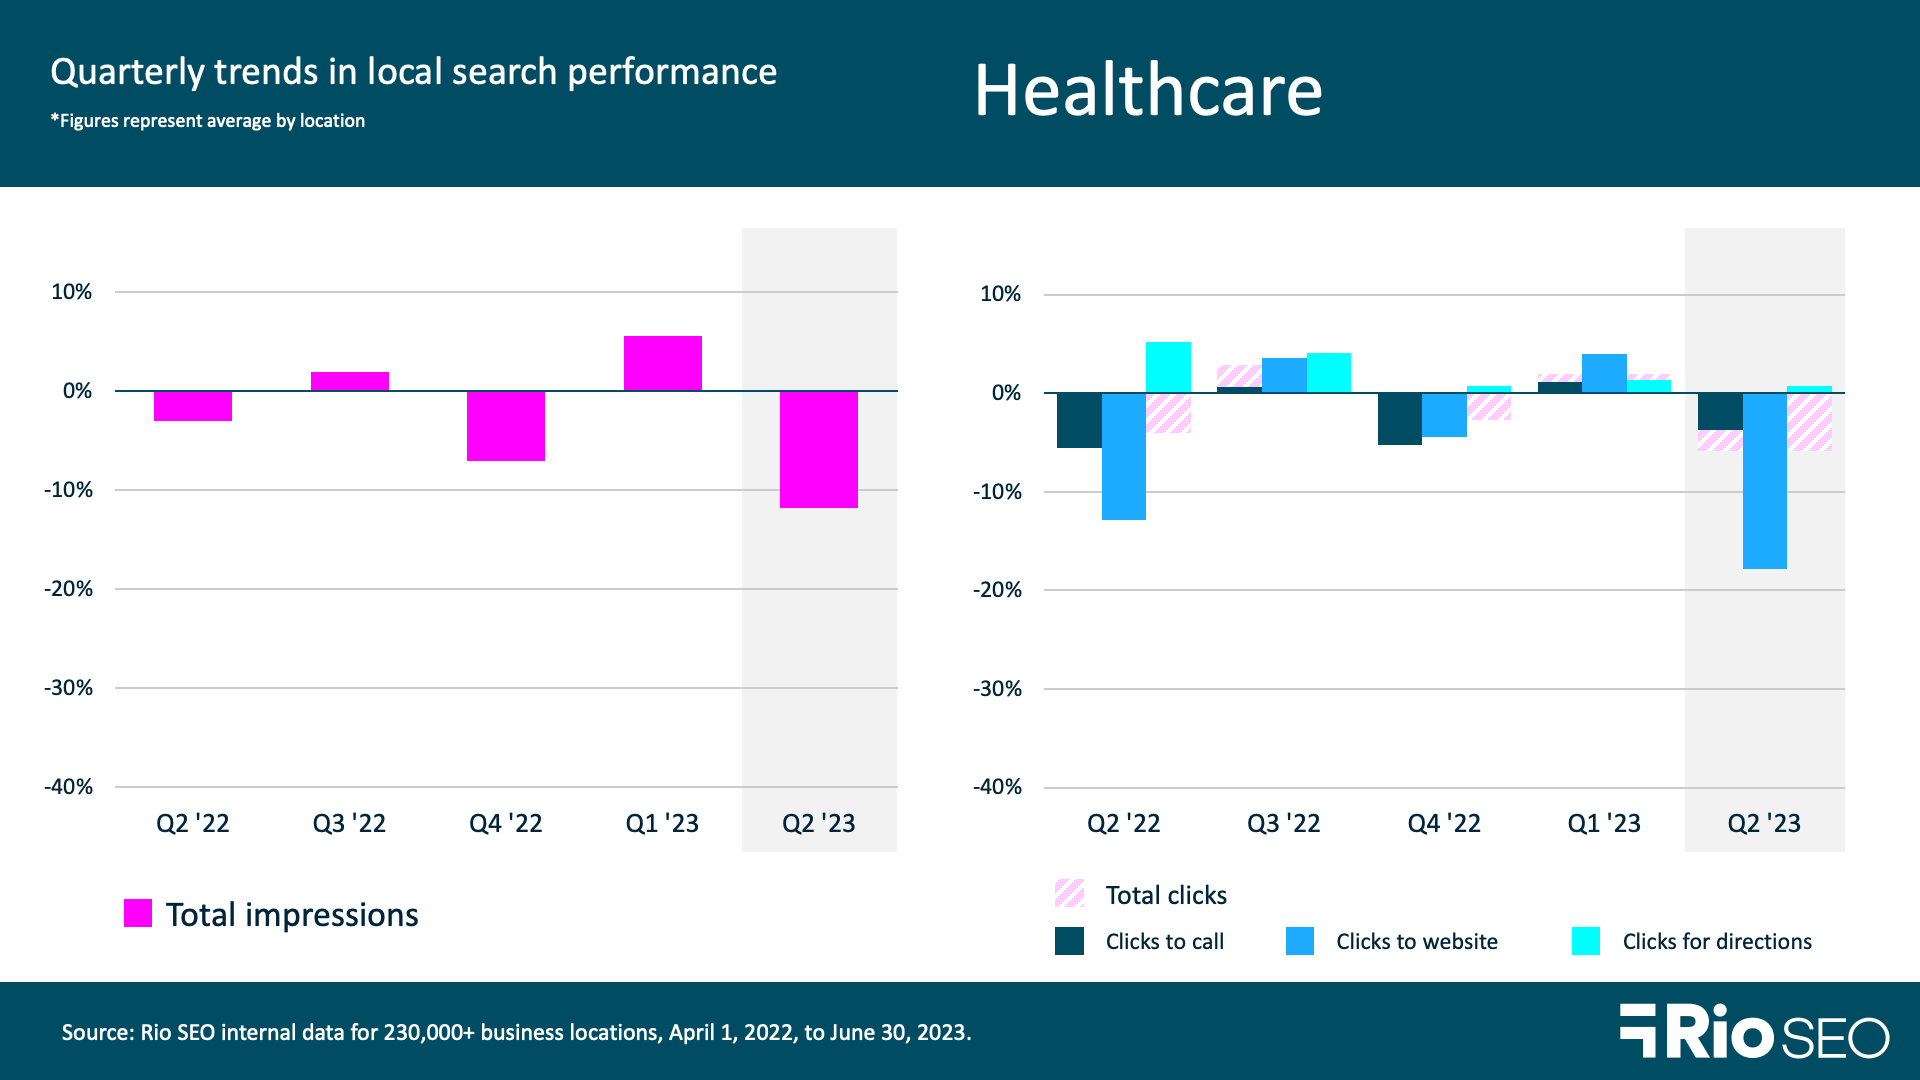
- Total Q2 2023 impressions: -11.8% QoQ and -11.9% YoY
- Total Q2 2023 clicks: -5.89% QoQ and -4% YoY
Search impressions and clicks on enterprise healthcare listings fell both quarterly and compared to Q2 last year by low double digits. We see the residual effects of the pandemic in play here, as well, as infections were more active one year ago.
Healthcare is another area where trust is a critically important part of the customer experience, and listing management is essential. Inaccurate or outdated hours of operation, location information, or other key business info can result in poor customer experiences and erode search engine trust in the brand.
Local listings and reputation management go hand-in-hand, and enterprise brands have the additional challenges of monitoring, engaging, and activating data at scale. Tidewater Physicians Multispecialty Group (TPMG), for example, had over 220 primary care, specialty physicians, and advanced practice clinicians across four medical groups when they reached out to us for help with several critical listings and reputation management challenges they were facing.
Our solution – which included optimizing nearly 100 profiles it its network, Local Reporting and implementing Star Ratings, and review generation and management – improved TPMG’s citation accuracy to 99.4%. Further, they saw an average of 34.5% more web impressions and 79.5% more web actions. Read their success story here.
Multi-family residential
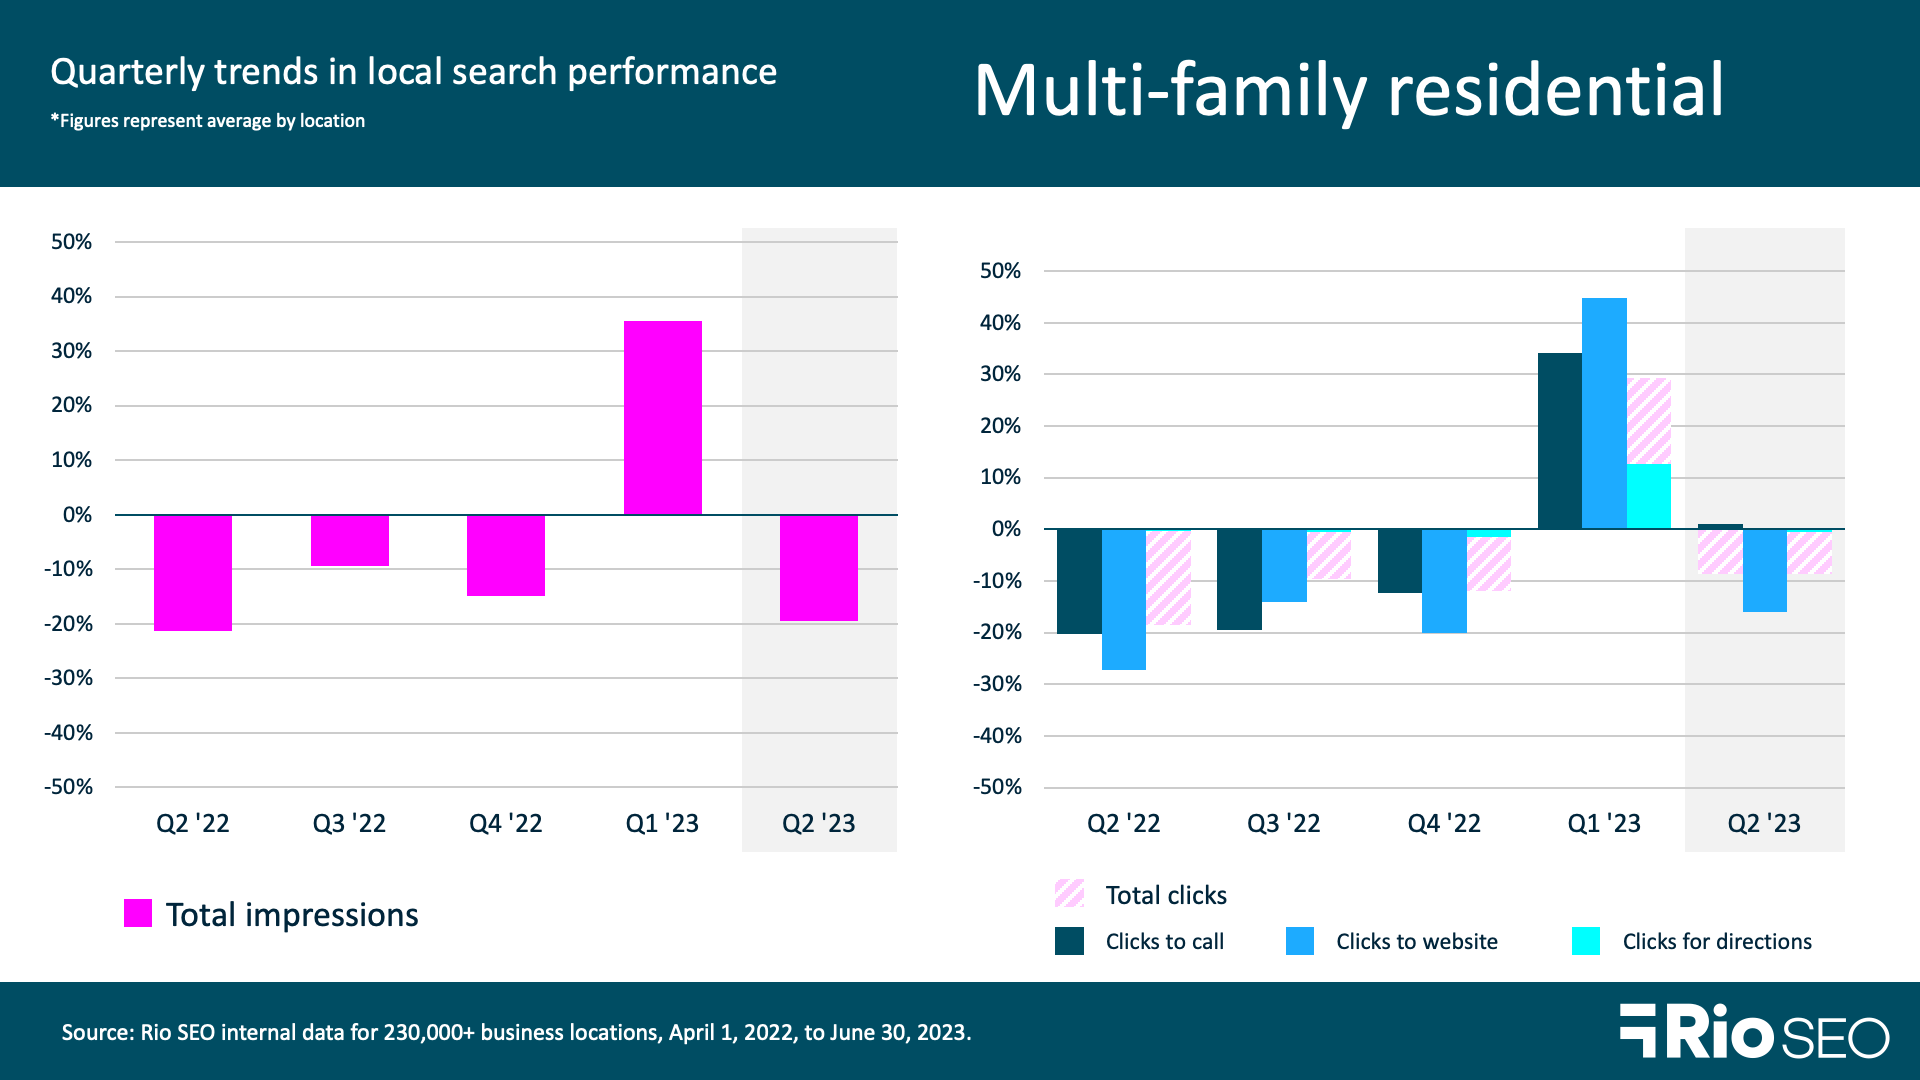
- Total Q2 2023 impressions: -19.5% QoQ and -15.9% YoY
- Total Q2 2023 clicks: -8.5% QoQ and -5.8% YoY
Multi-family residential brands saw total impressions drop 19.5% this quarter, on the back of a 35.5% increase in Q1. Total clicks followed a similar path with a 8.5% loss following on a 29.4% increase last quarter.
This tracks with industry analyses such as this one from Arbor, which references Moody’s Analytics CRE reporting showing a continuing slowdown in multi-family residential. Q2 average rents increased 3.8% YoY, while vacancies rose only slightly to 5%. Sales transactions of $55.6 billion through June 2023 put the segment on track for its lowest annual total in a decade.
This is a good time for brands to test the market and deepen your understanding of customer needs in the current conditions. This is particularly important when expanding into new regions or branching out into different segments of the category – from luxury rentals to budget, for example, or from townhomes to apartment complexes. See ‘9 key steps to conduct international market research’ for more tips on qualitative and quantitative research.
Want to learn more? See our latest in-depth analysis of Google Business Profile trends by vertical, and catch our 2023 Local search ranking factors breakdown webinar on demand now for more insights to fuel your enterprise local marketing strategy.