In this blog, we’ll discuss the expected outcomes of monitoring AEM as a Cloud Service (AEMaaCS) properties using New Relic One, some limitations, and how to do it.
What to Expect Using New Relic One
- Utilizing AEMaaCS, JMX MBeans, and health checks can be viewed within New Relic Insights for detailed application stack performance and health metrics analysis.
- Instrumented New Relic One APM agent that displays precise method calls with line numbers, including external dependencies and databases.
- Direct access to a dedicated New Relic One account.
- Complete performance enhancement by integrating essential metrics from infrastructure monitoring and Adobe Experience Manager monitoring.
Limitations Monitoring AEMaaCS Properties Using New Relic One
Accessing New Relic One
Here are the steps to access, give access, and remove access to New Relic One.
How to Access
Option 1:
- Log into Cloud Manager at cloudmanager.adobe.com and select the appropriate organization.
- Click on the program for which you want to access New Relic One.
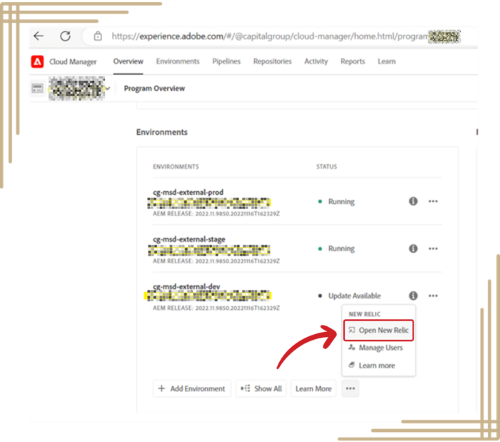
- At the bottom of the Environmentscard on the program overview page, click the ellipsis button and select Open New Relic.
Option 2: You can directly login to
How to Give Access
- Log into Cloud Manager at cloudmanager.adobe.com and select the appropriate organization.
- Click on the program that you want to manage your users in.
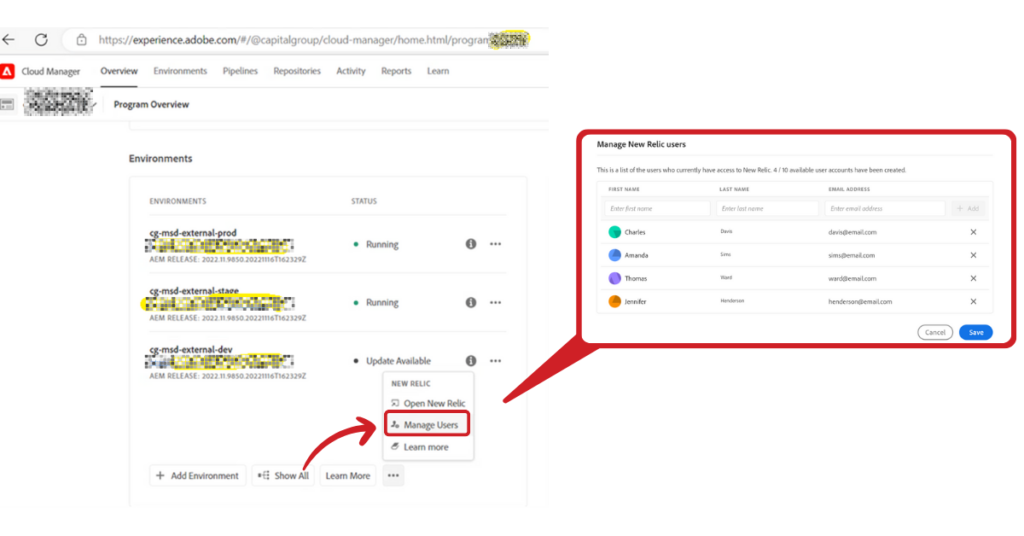
- At the bottom of the Environmentscard on the program overview page, click the ellipsis button and select Manage users.
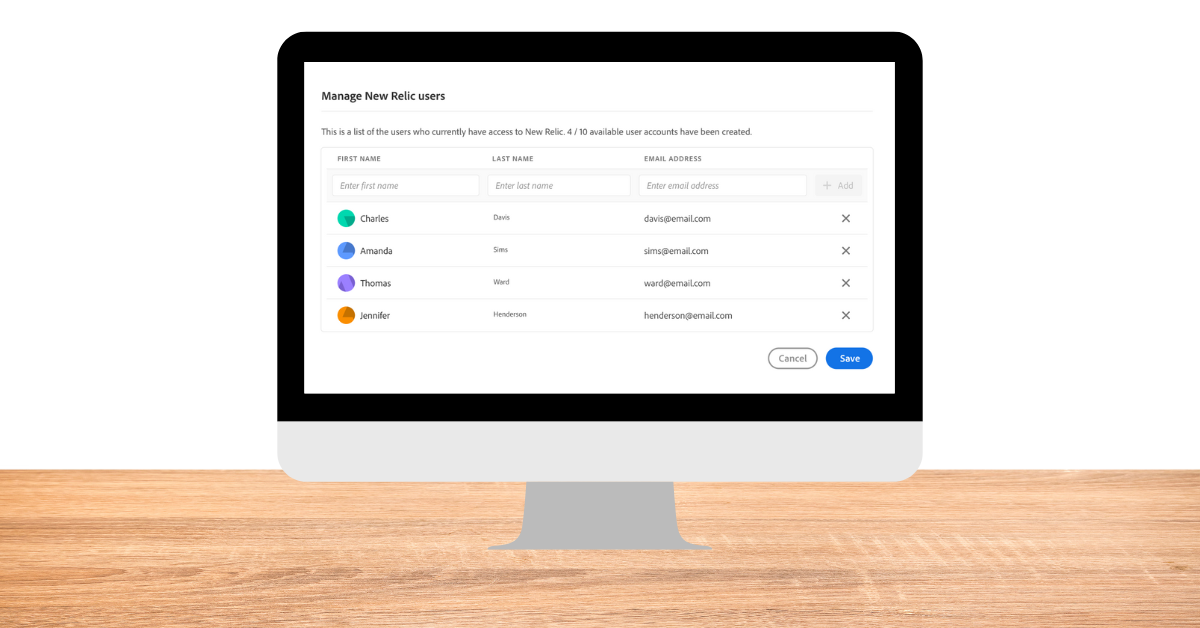
- In the Manage New Relic User’s dialog, enter the first and last name of the user you wish to add, and click the Add. Repeat this step for all additional users.
How to Remove Access
- Click the delete button at the right end of the row representing the user.
- Click Save to create the users.
Note: Custom SSO configuration is not supported for the New Relic One account provisioned by Adobe.
Monitoring AEMaaCS Properties
The following sections will examine how to navigate server monitoring and synthetic monitoring.
Server Monitoring
- Login in New Relic.
- Navigate to All Entities option in the left side panel and click.
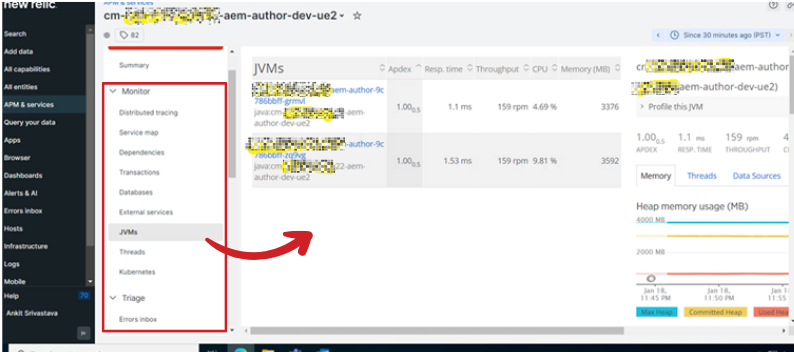
- Filter server name and when you click on your server name it navigates to a server summary page.
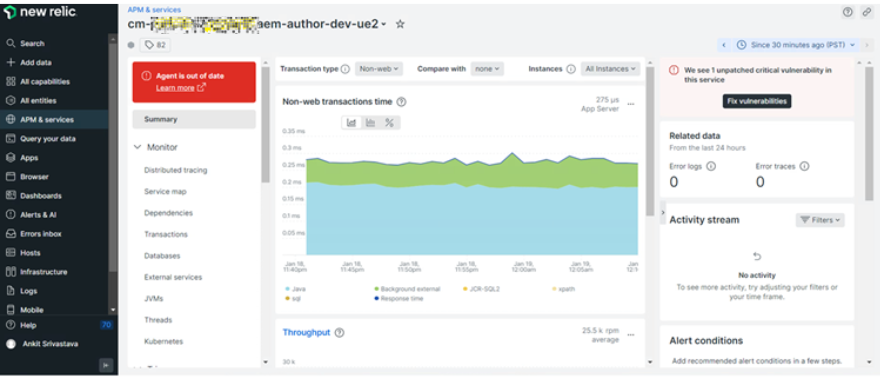
On the left side, you can see multiple monitor metrics, you can navigate there to also look at JVM, Threads, and more.
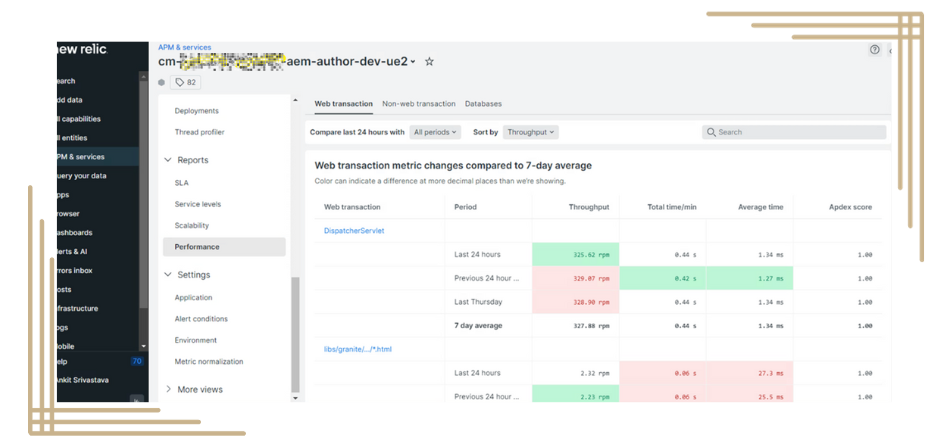
There are also a few pre-created reports that you can use as seen in the image below.
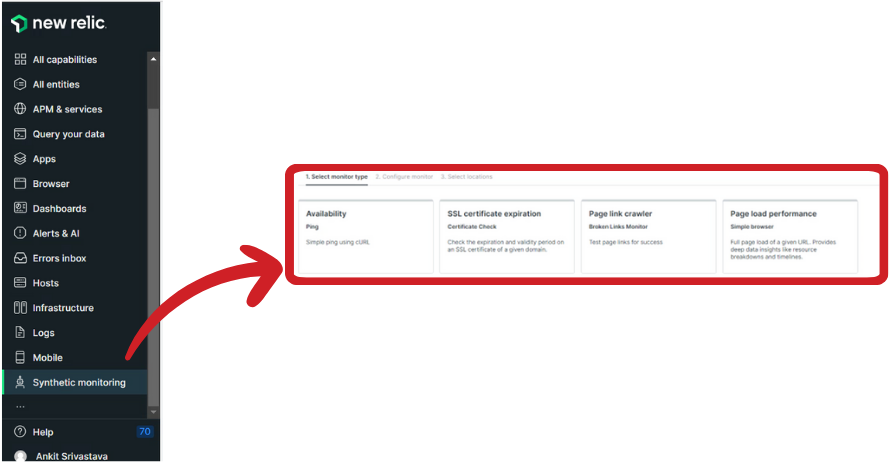
Synthetic Monitoring
- On the navigation panel, select Synthetic Monitoring.
- To create a synthetic monitoring, there is only one option you can choose.
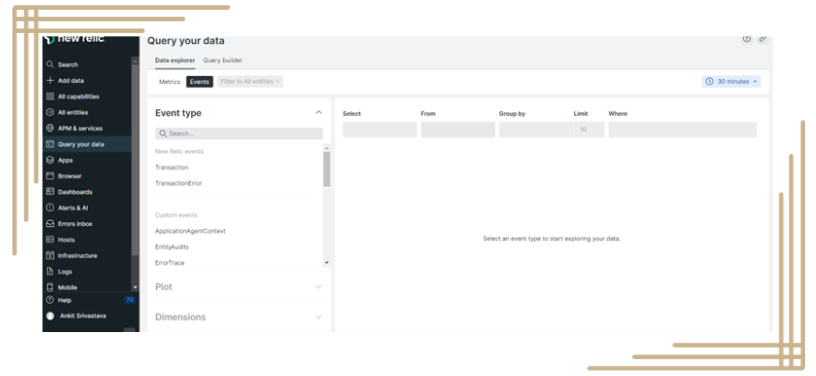
Bonus: You Can Access Event Data
There is also a query option to get custom-specific event data as well.
Maximum Visibility to Your AEMaaCS System
Hopefully, the information provided in this tutorial gave you and your team a better understanding of how to gain maximum visibility into your AEMaaCS system and environment performance metrics.
Check out some of our other Adobe blogs to find out other ways to get the most out of AEM as a Cloud Service.