
Posted by
Rank Ranger
There are two things we don’t need to tell you: your time is limited as well as valuable and Google Analytics is beyond important for good SEO. So, we would like to tell you that you can more easily and quickly access your Google Analytics data with the new widgets that have been recently added to Rank Ranger! Did we mention that you can add all of these widgets to our white label and automated reporting options so that you can share deep Analytics data with experts and novices alike?
Join us for a quick survey of the Analytics widgets and how you can use them inside of Rank Ranger for a higher level of data reporting!

#1 The Google Analytics Overview Widget
What better place to start than with a widget that expediently audits your overall traffic performance in one fell swoop. The Google Analytics Overview Widget combines a trends chart with a data snapshot that includes insights on your users, sessions, bounce rate, and average time spent on site:
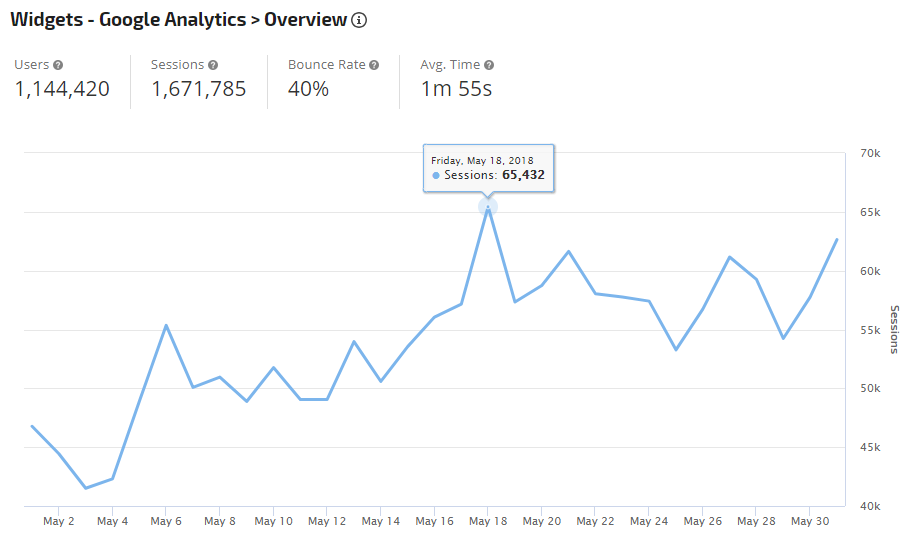
What makes this widget dynamic is not only the ability to show a slew of Analytics metrics within the trends chart (i.e., anything from New Users to Page Views to Hits and so forth) but that the widget also enables you to quickly understand your performance relative to other reporting periods.
To this extent you can set the widget to compare your current Analytics data to that of the previous period:
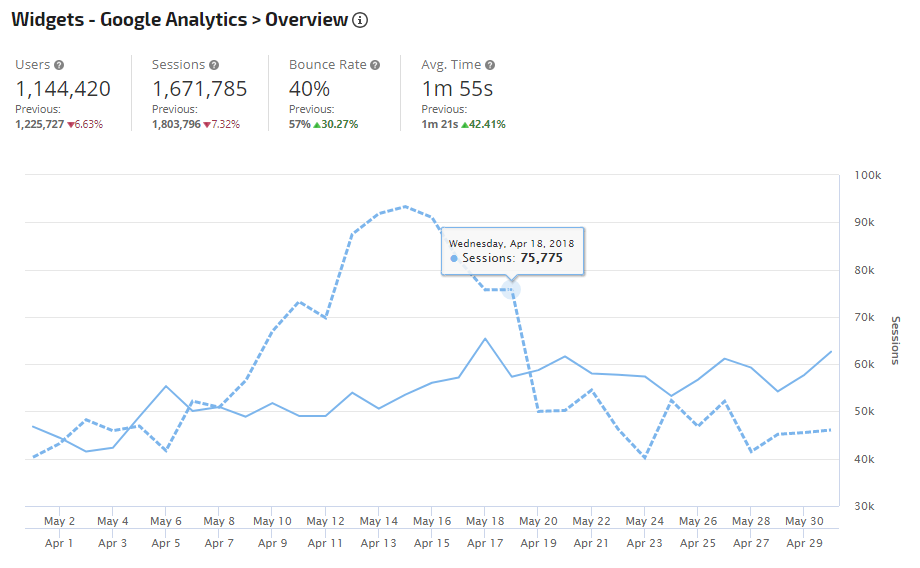
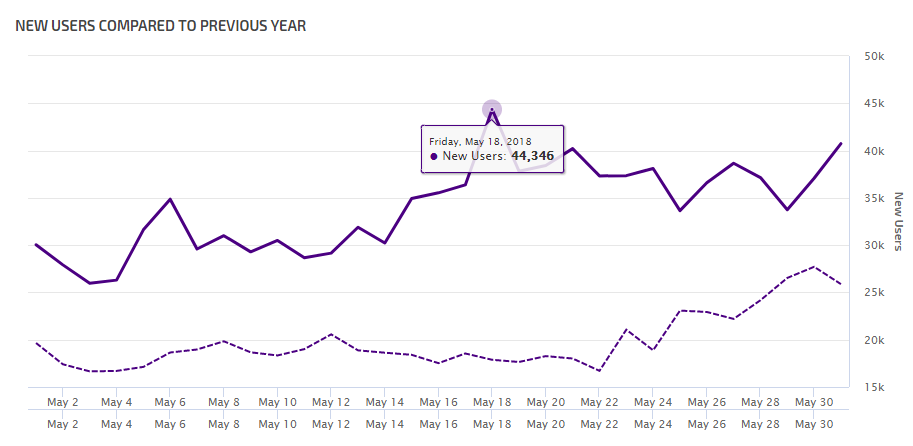
You can get an ever broader peek at your performance by setting the widget to show year-over-year Analytics data:
#2 The Google Analytics Active User Trends Widget
Getting deeper into your Analytics reporting and giving you speedy insight into how users are interacting with your site is the Google Analytics Active User Trends Widget. Succinctly, this widget makes tracking how users behave on your site on a daily, weekly, and monthly basis seamless and simple. With the hover, you get a snapshot of cumulative totals and conversion trends simultaneously and instantly, like as shown directly below:
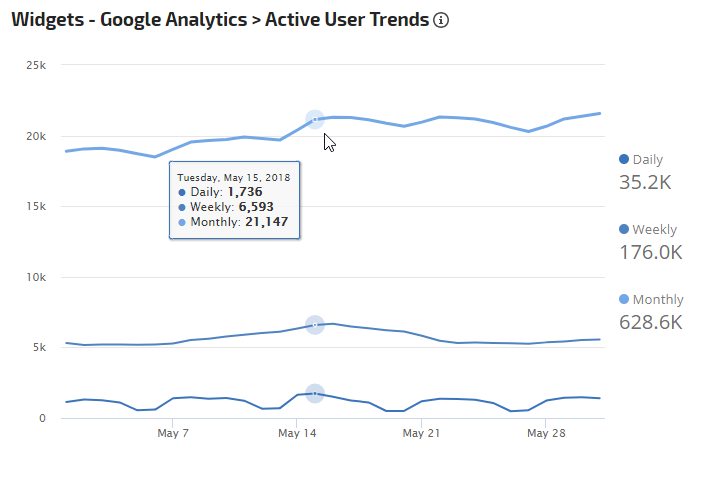
You can custom set the widget to show data according to specific goals and according to various segments and events.
#3 Google Analytics Goal Performance Widget
It’s all about conversion rates and completions! The Google Analytics Goal Performance Widget offers a simple and straightforward way to monitor how effective your conversion strategy is
- Goal Completions
- Conversion Rate
- Goal Value
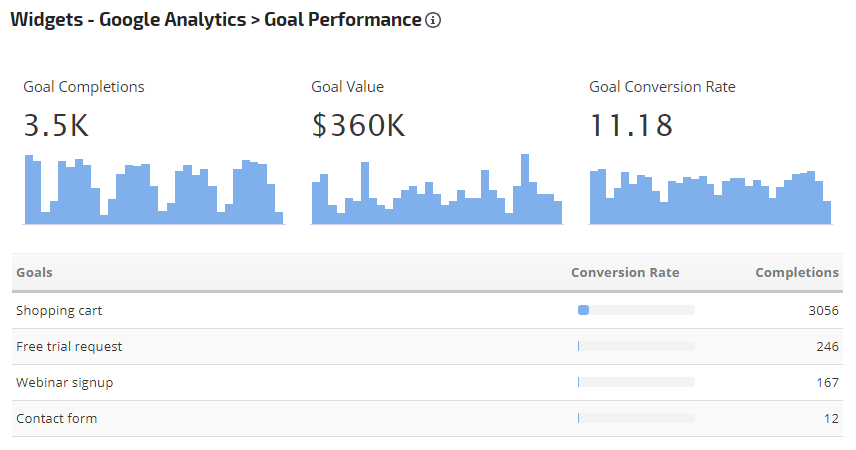
The supplementary chart is a great add-on that helps you easily
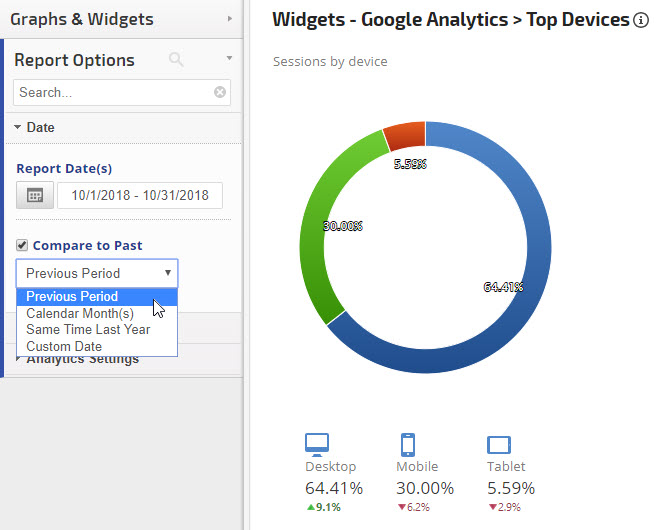
#4 The Google Analytics Top Devices Widget
With the growing importance of device segmentation that follows the rise of mobile usage we have the Google Analytics Top Devices Widget:
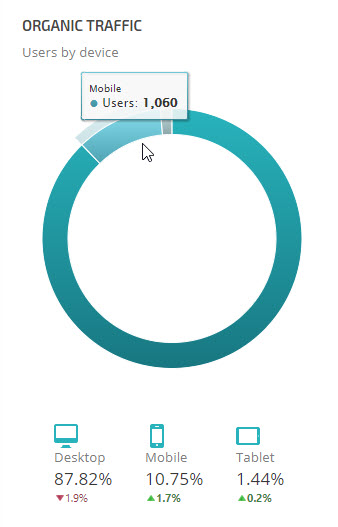
If you want to get a quick and easy way to digest a breakdown of your site’s traffic by device, this a great way to do so. The widget’s simple and highly discernible visual breakdown of your traffic sources by
Additionally, the provided icons offer a quick look into the actual numbers represented in the widget’s visual depiction. You also have the option of showing this data in comparison to previous reporting periods, which allows you to quickly take in this slice of analytics data without sacrificing depth, and without too much of a time investment either.
You can even filter according to specific goals to see device performance as it relates to the distinct nature of the goals you have set up for yourself in Google Analytics.
#5 the Google Analytics User Retention Widget
Last, but not least, you can now track your user retention by cohort directly in Rank Ranger. The Google Analytics User Retention Widget is a straightforward way to track how powerful and long-lasting your user engagement is.
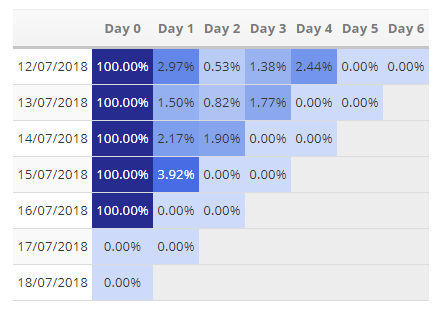
Here, like the other widgets, you can establish the parameters of the data you want to be shown. To this extent, you can select the size of the cohort, the data **** range, and filter by various segments. Of course, the true beauty of having this chart inside of Rank Ranger is that like the four aforementioned widgets, it can be added to one our white label reports (but more on that shortly).
Easy Google Analytics White Label Reporting & Widget Customization
Yes, the widgets were designed to offer you maximum data with minimum time, but that doesn’t mean they are lacking in customization and reporting options. You have both the ability to set your widgets up according to multiple custom options as well as place them within a variety of white label reports.
Custom Options for the Google Analytics Widgets
As we’ve already alluded to, each widget can be filtered to show definitive and apportioned Google Analytics data. Whether it be showing data related to specific goals or segments, you can choose which information is most relevant to your analysis.
Further, you can custom select the **** range for which you would like data displayed for. This includes the ability to compare data to previous periods (to the exclusion of the Google Analytics Goal Performance and User Retention Widgets).
At the same time, go ahead and create the color scheme that feels right to you and
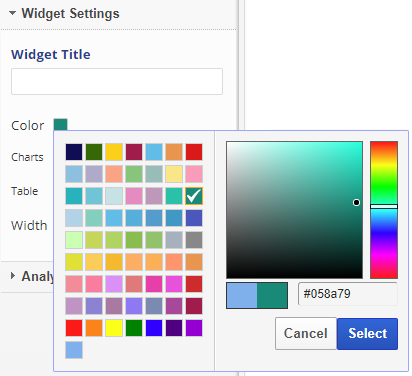
The color palette found within the report options
Efficiently Showcase Your Google Analytics Success
We’ve saved the best for last.
Making time work on your side, inserting visually striking Google Analytics widgets into a white label report is a great way to showcase your success in a way that is both aesthetically pleasing and translatable (especially if whoever you are reporting to is not an Analytics expert).
In specific, this means you have the option to add your Google Analytics widgets to automated PDF reports, to real-time Client Dashboards, or to the juggernaut of all reporting dashboards, The Marketing Dashboard (which is a 100% white label option that gives you full access to the HTML and CSS so that you can make your dashboard look and feel like any site).
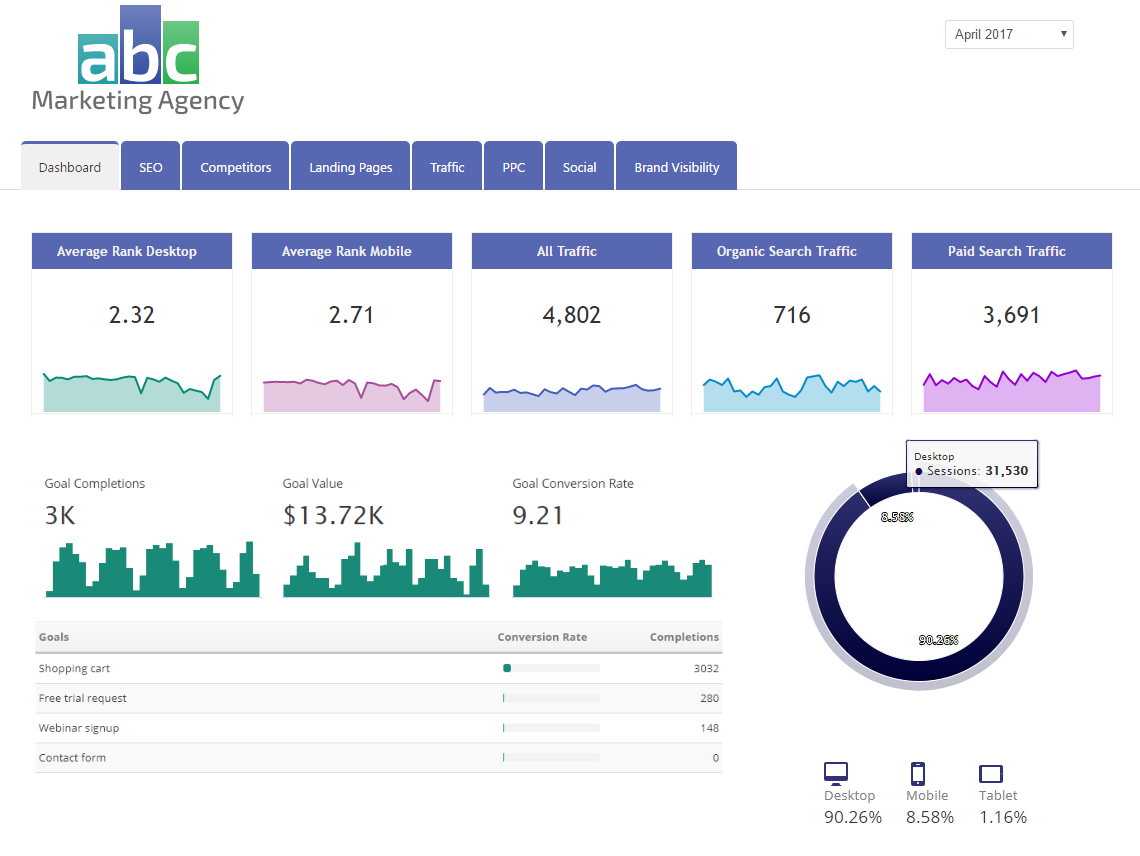
Google Analytics widgets showing under a series of Single Metric Widgets that present data on both rank and site traffic
Whatever your choice, and whether you report internally or to clients, inserting Google Analytics widgets into white label reports allows you to give the gift that is simple straightforward data which is not only easy to interpret but provides a degree of reporting depth and meaning.
Share Speed, Simplicity, and Style
We want you to understand one thing; we know that tracking, monitoring, and especially reporting all of your SEO efforts can be overwhelming and often too time-consuming. With that, we wanted to offer you a way to share your site traffic success in a way that made deciphering your achievements easy for all to see, whether they be the head of an SEO department or a small business owner. After getting a glimpse of how simple, yet powerful, the new Analytics widgets are within our white label reports, we hope you’ll see that showcasing traffic insights can be easily made accessible to those who are not SEO experts.
Combine these five new widgets with the Stacked Columns and Google Analytics Pie Chart/ List widgets, and you have yourself one seriously comprehensive set of Google Analytics data sources that have the potential to save you time and bring you and your
The Google Analytics widgets can be found within our platform
About The Author