Google Analytics 4 (GA4) is the newest version of Google’s analytics platform. It helps you measure things like your website’s traffic, user behavior, and conversions.
Users in Google Analytics are one of the main metrics the platform focuses on. Let’s look at how users are defined, user tracking features, and how you can use this data to improve your website’s performance.
What Is a User in Google Analytics 4?
A user in Google Analytics 4 is an individual who initiates a session on your website. The analytics platform tracks the user’s behavior as they engage with your pages.
How GA4 Identifies Users
GA4 uses several methods to identify and differentiate users:
- User ID: A unique identifier you can manually assign to users who are logged in to their account on your website. It tracks user journeys across devices, and it’s the most accurate method of identification since you’re collecting the data directly from the user.
- Google signals: Session data from sites that Google associates with users who have logged in to their Google accounts and have opted into ad personalization. It’s useful for analyzing audiences, conversions, and running retargeting campaigns in Google Ads.
- Device ID: Identifies user sessions across devices. On websites, it comes from first-party cookies (cookies stored by the website), derived from the “_ga” cookie (the main Google Analytics cookie that distinguishes one visitor from another). This method tracks only the device and not the user.
- Modeling: Behavioral modeling helps fill the gaps in your data. When users decline analytics identifiers (like cookies), behavioral data isn’t available. GA4 ****** the behavior of these users based on data from similar users who accept cookies on your site.
How User Data Changed Between Universal Analytics and GA4
Universal Analytics (UA) had two user types: total and new. UA relied on cookies for tracking users.
There are now four user types in GA4: total, active, new, and returning. GA4 offers multiple identification methods, as outlined in the previous section.
Understanding GA4’s user types provides helpful insights you can use to optimize your site’s performance.
GA4 User Types Explained
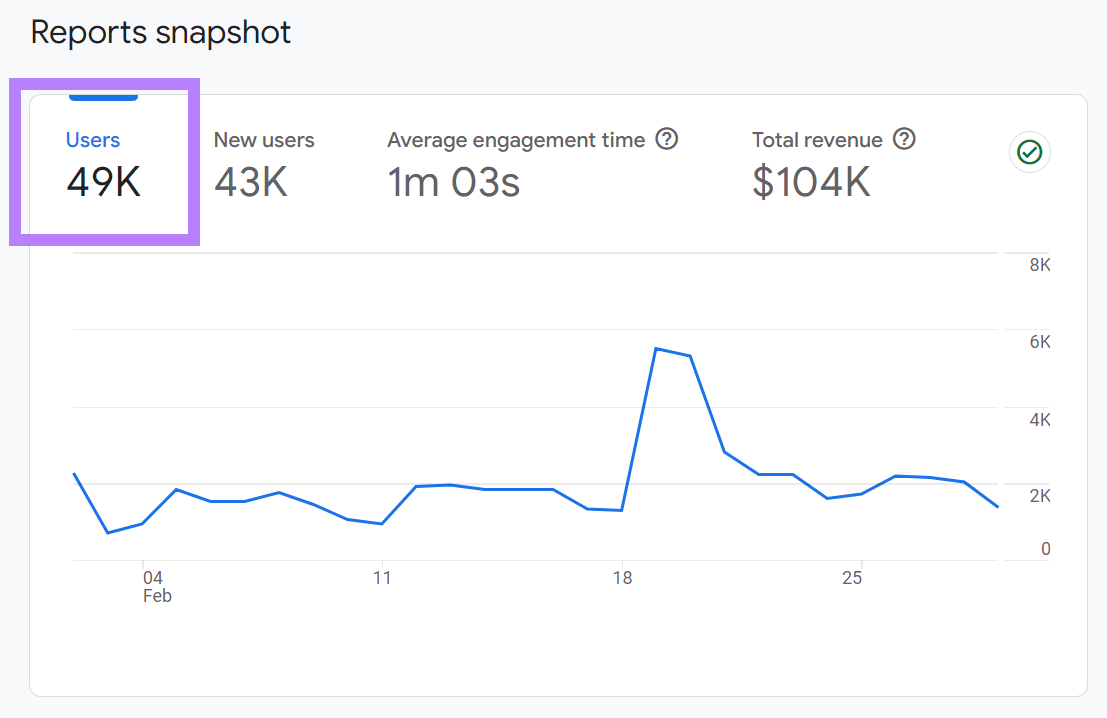
Before we go into the details on each of the user types mentioned above, it’s worth noting that you can typically find data for each of them quite easily on the Home tab of your GA4 dashboard.
Click the arrow next to any of the metric headers at the top of the overview card.
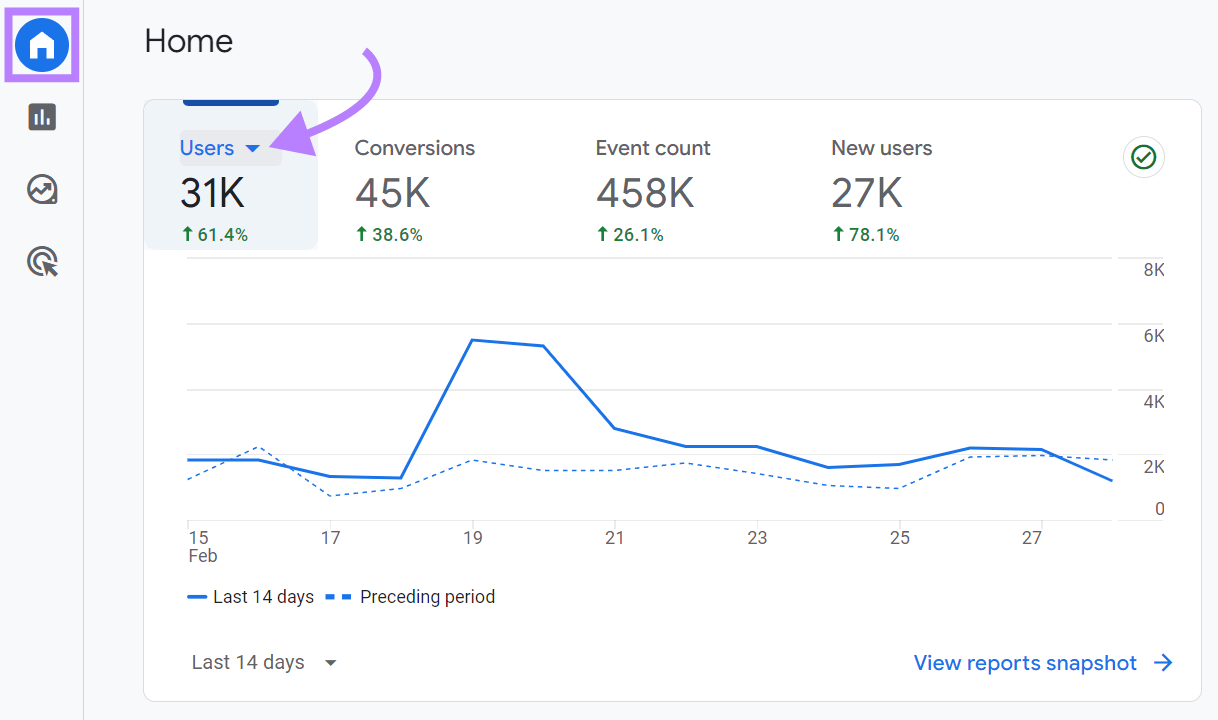
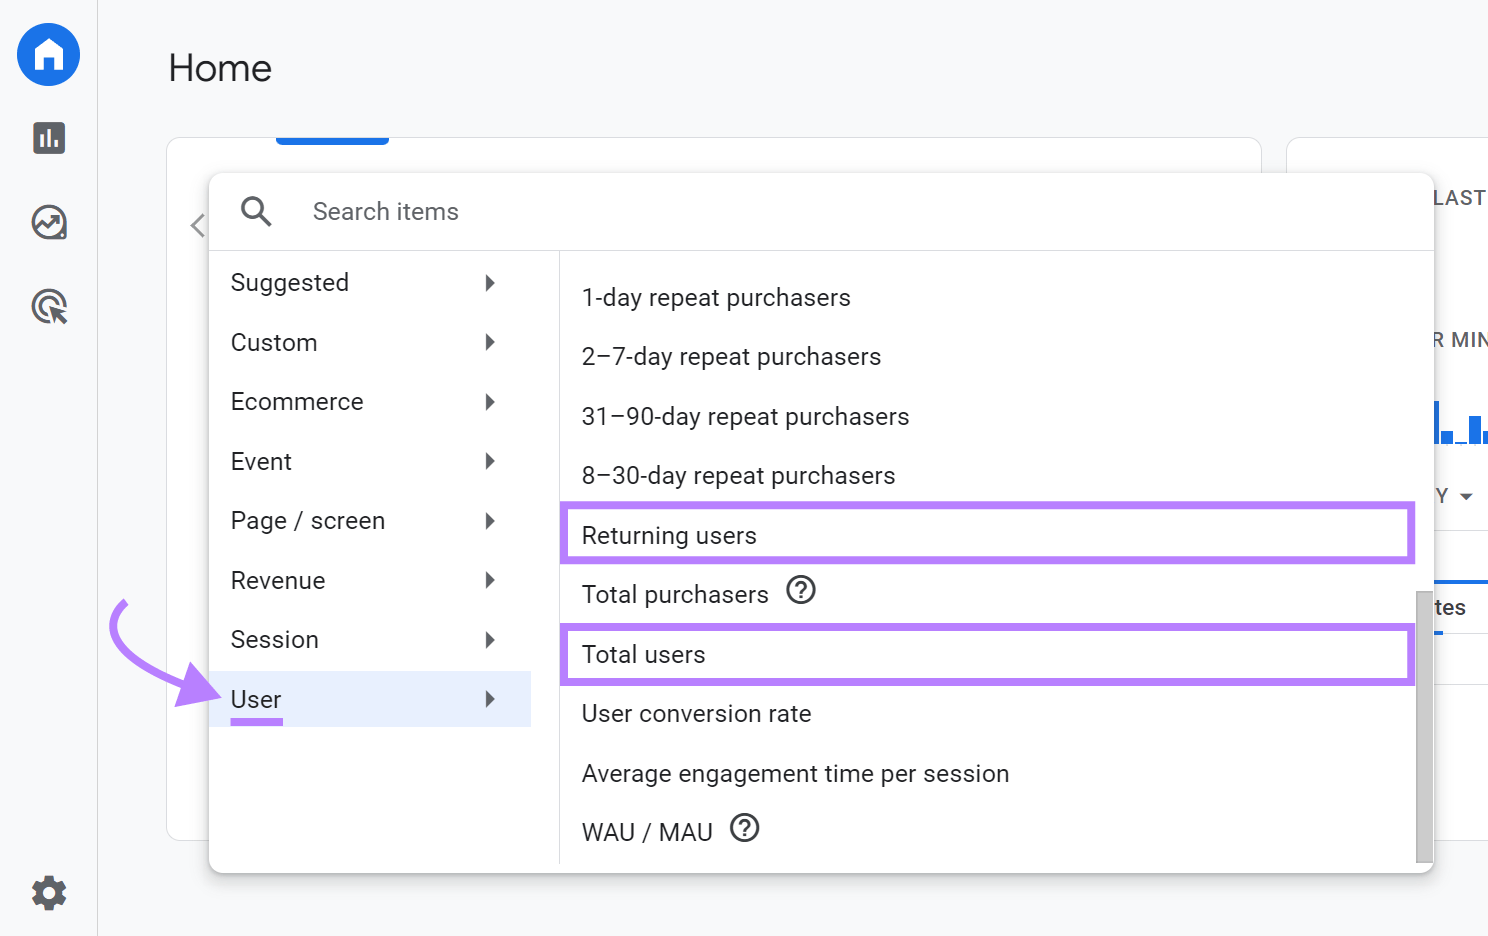
In the menu that appears, click “User” to reveal a list of user-related metrics. In this menu, you can choose any of the four types to replace the current header with that one and display the relevant data in the overview card.
Let’s look at what each user type tells you about the people visiting your website.
New Users
The new users metric tells you the number of people who have previously never visited your site, within your specified time range.
Google relies on a unique identifier called a user ID to distinguish between users. When a user visits your site for the first time, they trigger the “first_visit” event. Google recognizes these visitors as new users.
Returning Users
Returning users data represents the number of users who have visited your site at least once in the past. The GA4 cookie that identifies unique users will last for two years. At that point, a returning user will then become a new user.
When users return to your site, they likely find value in what you have to offer. Returning users is a key Google Analytics metric to understand user retention and customer loyalty.
Total Users
Total users represents the total number of people who visited your site during a specified **** range.
This Google Analytics user type includes both new and returning users, providing a comprehensive overview of your audience.
Active Users
Finally, active users data (also referred to as just “Users” in GA4) represents the number of people who engaged with your site during a specified **** range. This number includes new users.
An active user is any single user who either:
- Had an engaged session. This means they stayed on your page for 10 or more seconds, recorded two or more pageviews, or completed at least one conversion event.
- Triggered the first_visit event (meaning they’re a new user) or the engagement_time_msec parameter (this records user engagement time)
How to Analyze User Data in GA4
Analyzing Google Analytics user data helps uncover what your visitors engage with, and what keeps them coming back.
Uncover patterns, spot opportunities for improvement, and optimize your content to turn more visitors into customers. Here are a few ways to do this:
Analyzing User Events
Analyzing user events allows you to understand if users are taking the actions you want them to take.
Learn how your users interact with your content by clicking “Reports” in the left-hand navigation. Then click “Engagement” > “Events” in the drop-down menu.
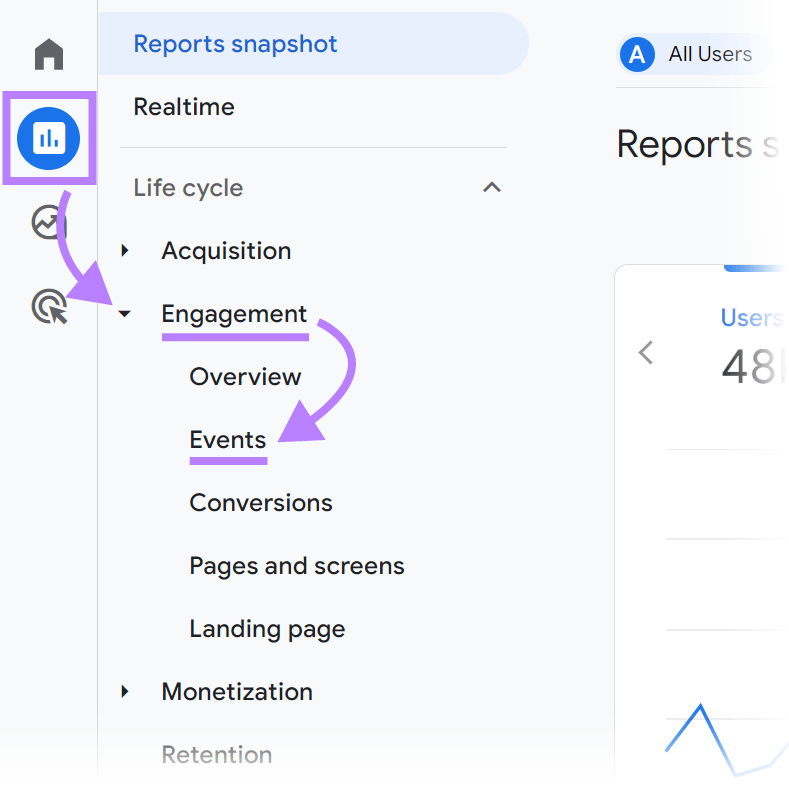
Below the line chart is a table that includes a column for “Total users.” This is where you’ll see a list of all events that occurred during the specified time period and for how many users.
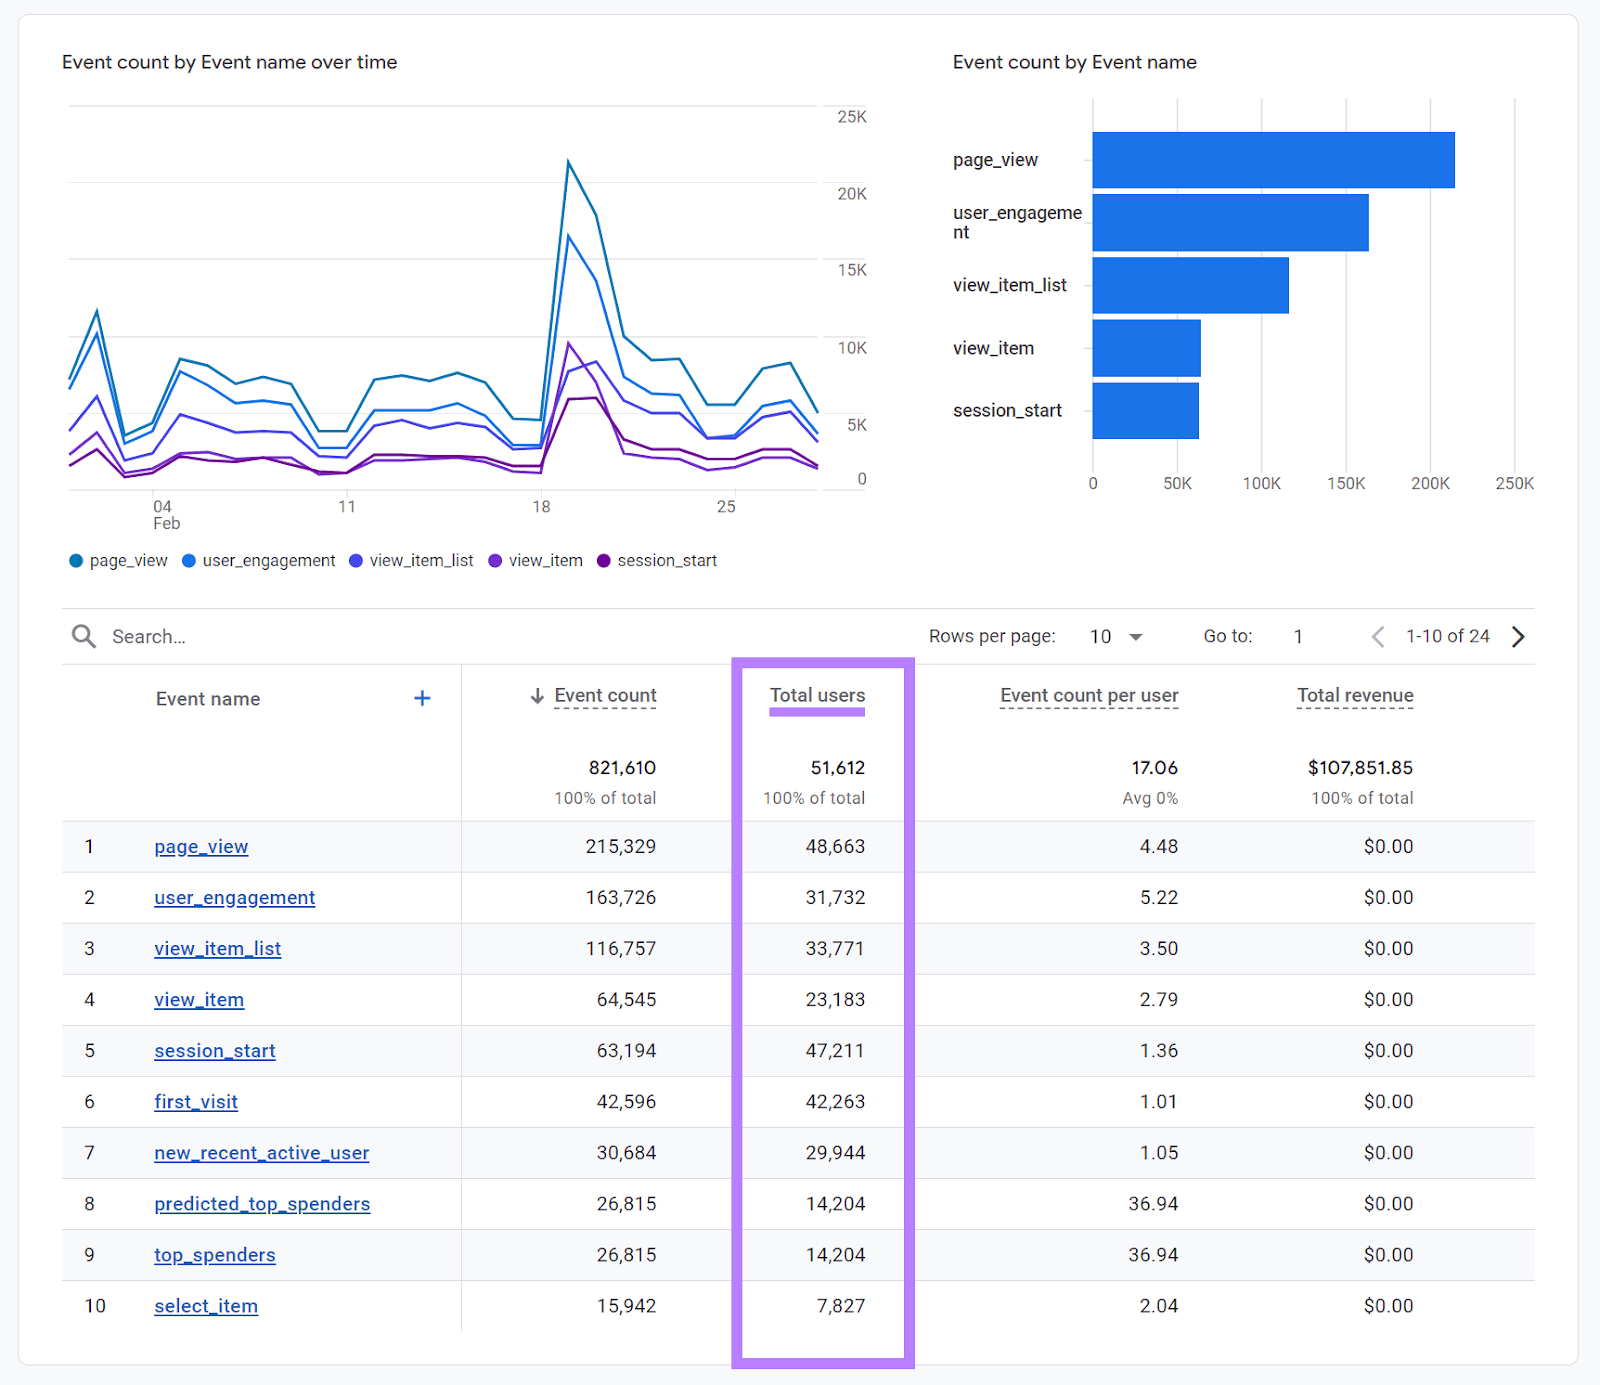
Here, learn how your users interact with your site, such as downloading a file, scrolling down the page, playing a video, or submitting a form.
A low number of event counts can help you determine whether to make site changes to encourage certain desired actions.
For example, a low number of “form_submit” events could mean your sign-up forms aren’t working properly, or your pages aren’t optimized to encourage users to complete them.
Analyzing User Acquisition Channels
User acquisition data helps you understand how well your search engine optimization (SEO), social media, and other content marketing strategies are working.
Identify where new users come from by clicking “Reports” in the left-hand navigation. Then click “Acquisition” > “User acquisition” in the drop-down menu.
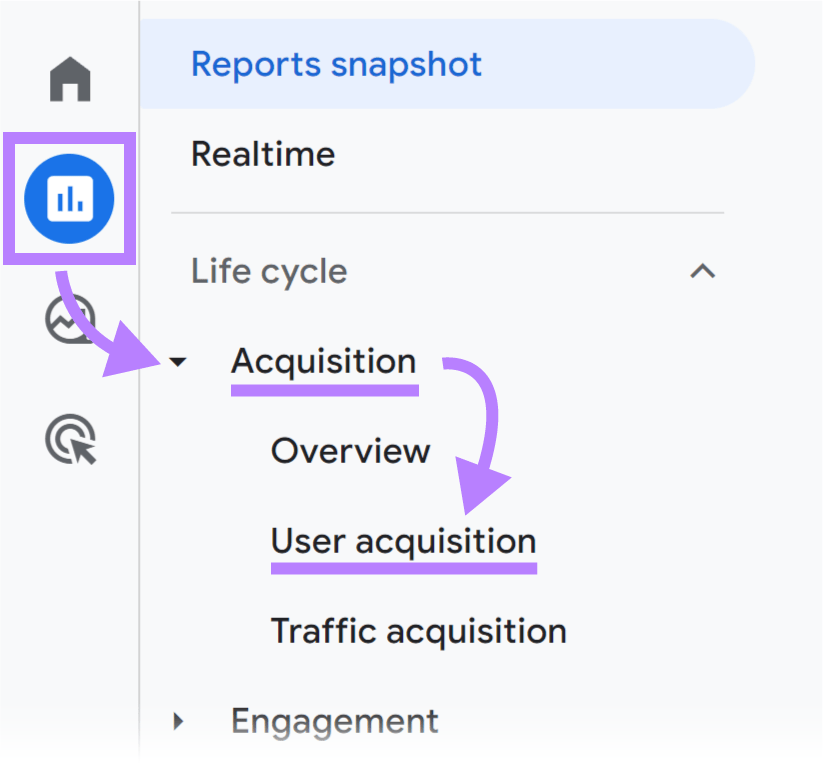
Below the chart, you’ll see a table that includes a column with new user data. This is where you’ll see a list of channels that new users are coming from (such as direct, organic search, and referral), along with corresponding engagement metrics.
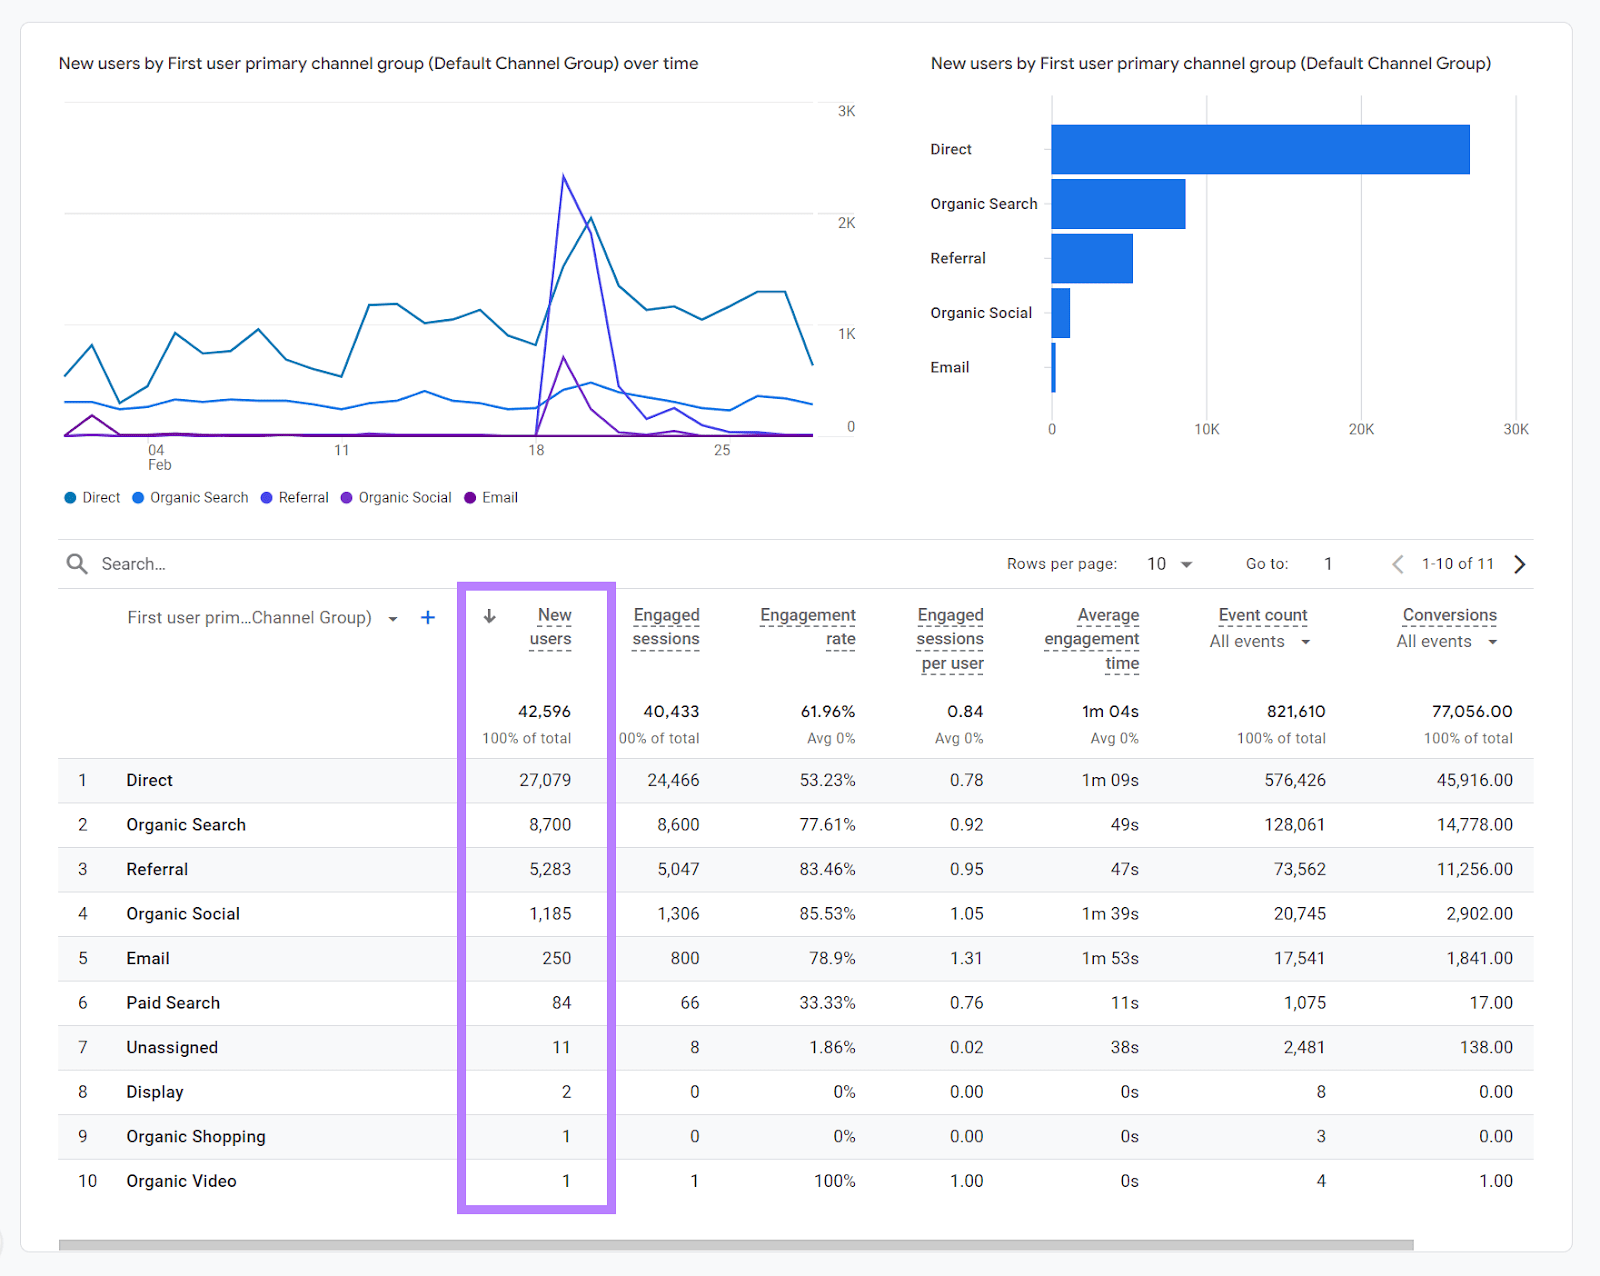
For example, if you’re running a social media marketing campaign, you’ll ideally see users arriving at your site through “Organic Social” (or “Paid Social” if you’re running a paid social campaign).
Analyzing User Engagement Metrics with the Pages and Screens Report
The “Pages and screens” report is great for understanding key user engagement metrics. It can help you determine which pages get the most attention and generate the most conversions. And which ones you might want to update first.
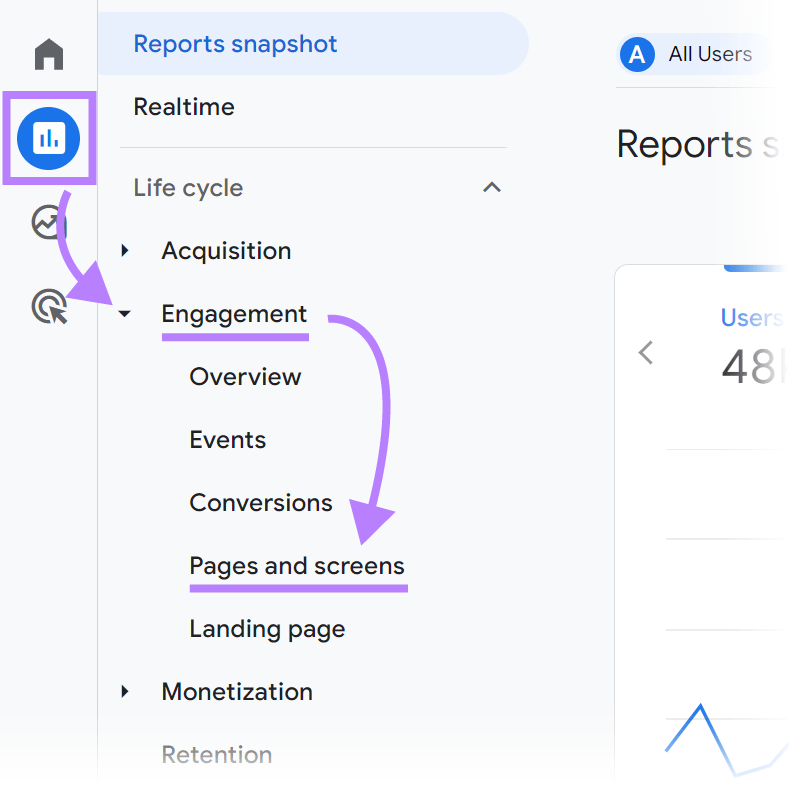
To find this data, click “Reports” in the left-hand navigation. Then, click “Engagement” > “Pages and screens” in the drop-down menu.
Below the line chart, you’ll see a table of your pages sorted in descending order of most pageviews. You can sort by users instead by clicking the arrow next to the “Users” header at the top.
Notable engagement metrics for these pages include:
- Views per user: Average number of pages viewed per user
- Average engagement time: Average amount of time the page was in focus in the user’s browser
- Conversions: Number of times users triggered a conversion event
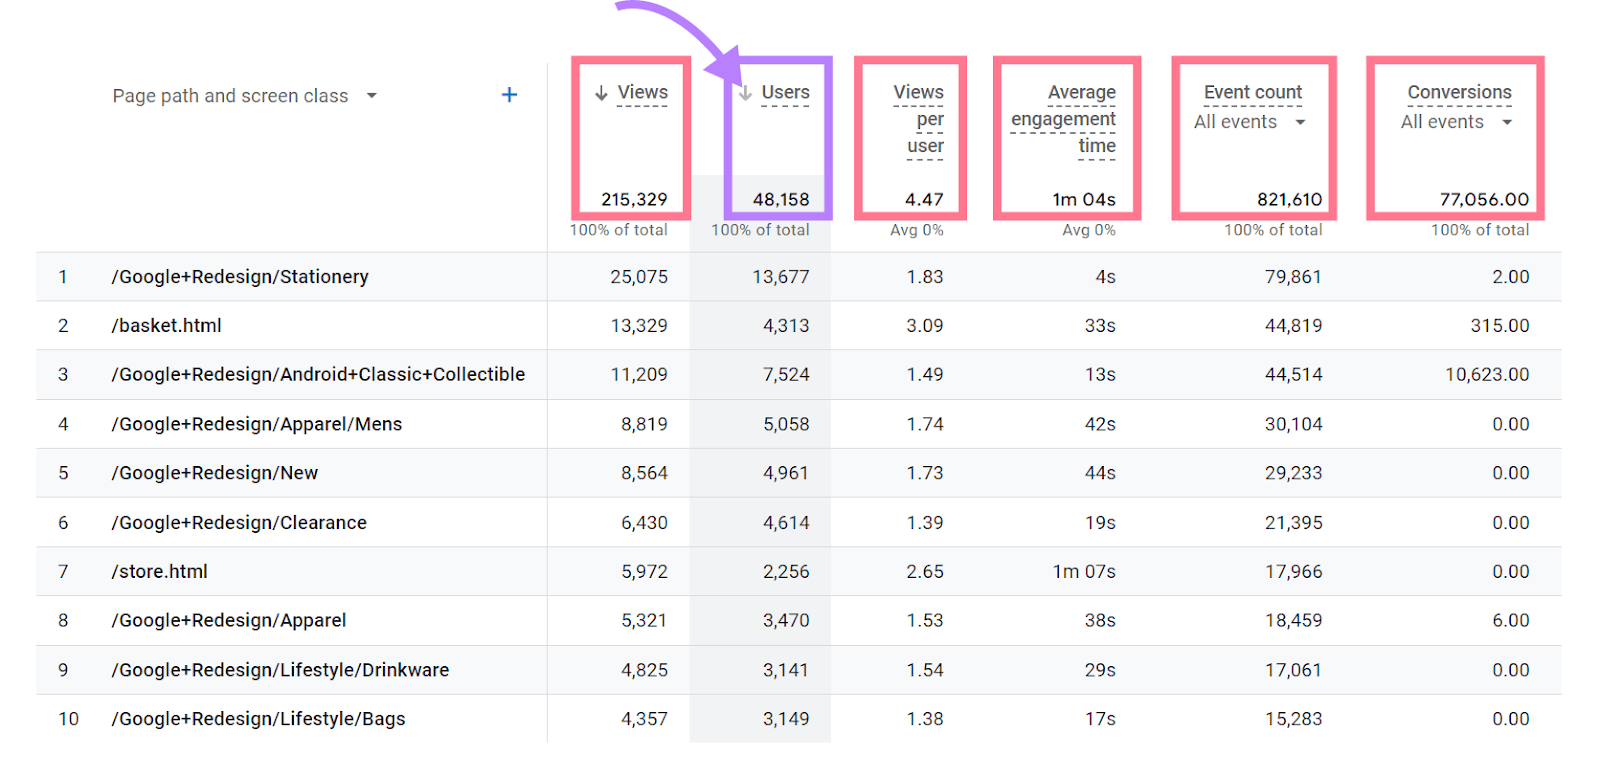
The average for some of these metrics is shown below the header (for others the number shown is the total, like under the “Event count” header). Look for pages with below-average key metrics like average engagement time. These are pages you may consider updating first.
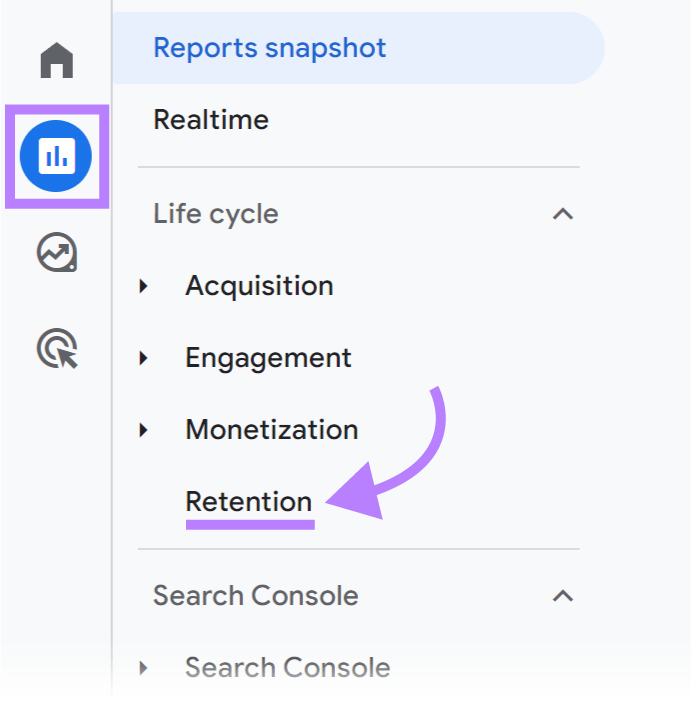
How to Analyze User Retention Metrics
Analyzing your returning users can help you understand how well you’re building loyalty with your visitors and customers.
Find data on your returning users by clicking “Reports” in the left-hand navigation. Then click “Retention.”
A line chart shows new users as the default display. Click “Returning users” to change the chart to show returning users.
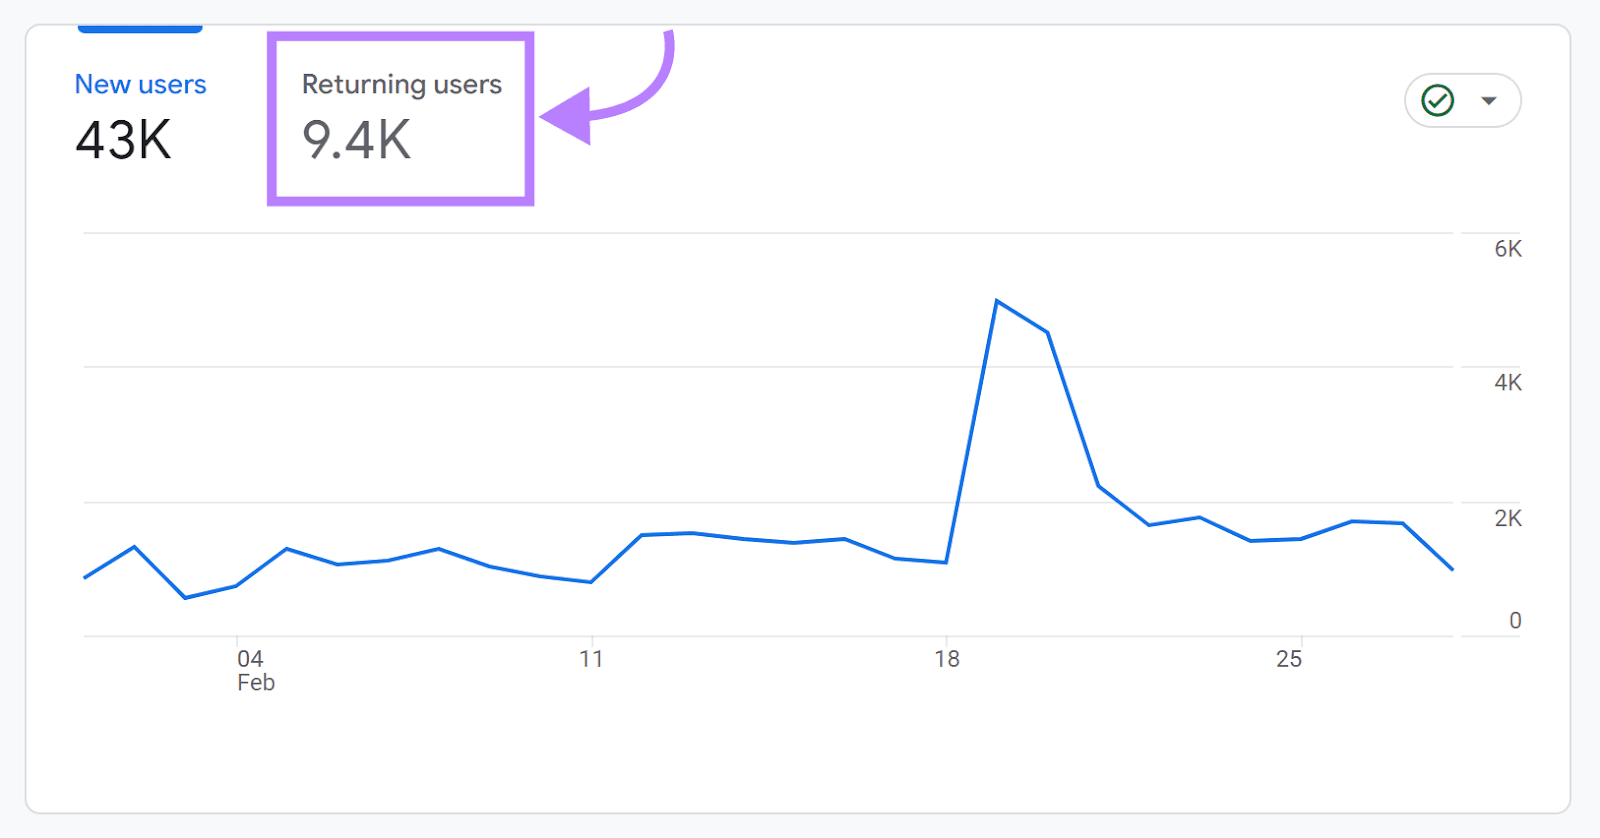
The data in this report is somewhat limited compared with the other user metrics.
However, comparing your new users to your returning users can provide insights on how engaging your content is. Ideally, your returning user graph is an upward trend over time as you build customer loyalty.
Analyzing GA4 User Demographics
You can also use Google Analytics 4 to understand user demographics. This enables you to learn where your users are located and what languages they speak. If you enable Google Signals, you can also learn about their age, gender, and interests (but beware this could result in data thresholding).
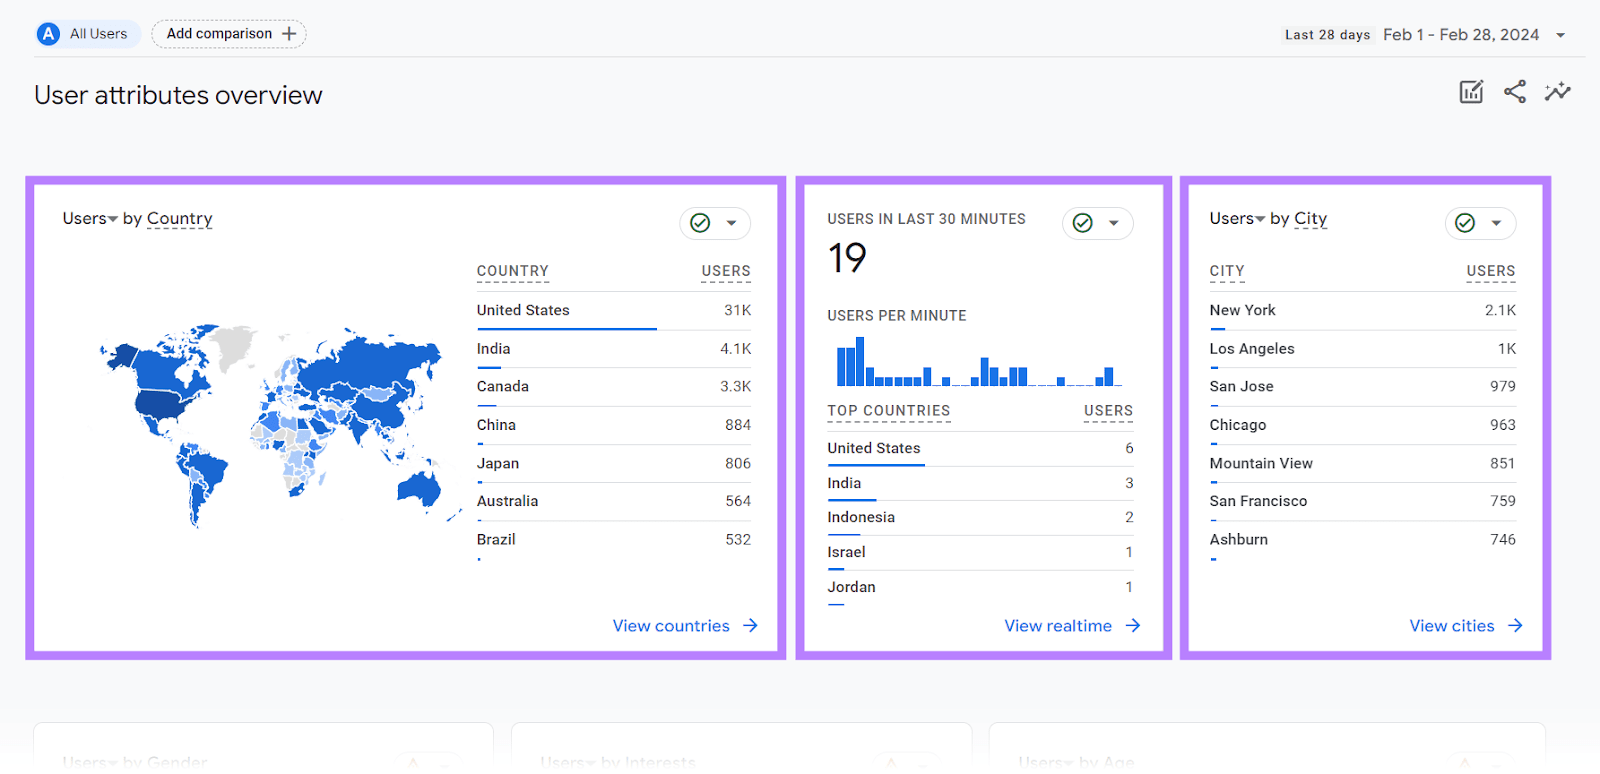
To find data about your user demographics, click “Reports” > “User” > “User attributes” > “Overview.”
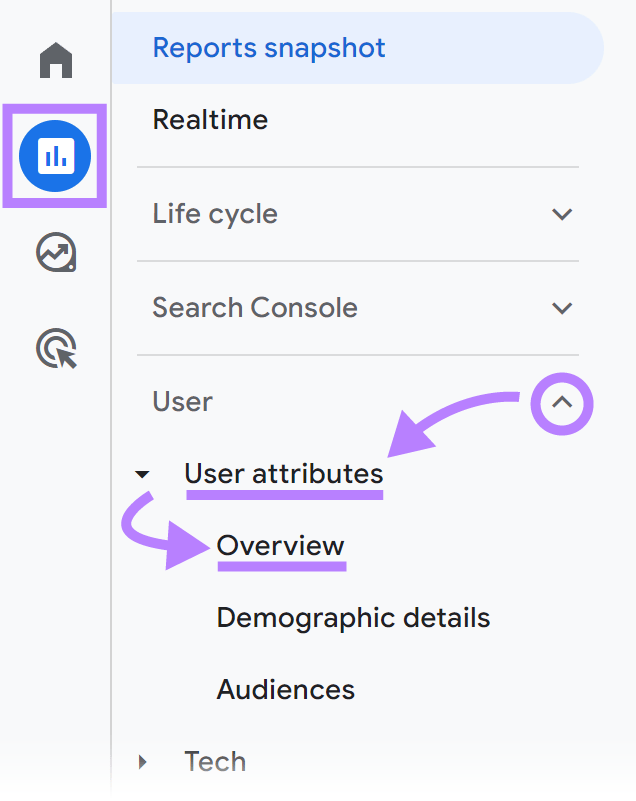
This shows an overview of your user demographics, with cards for country, users in the past 30 minutes and their corresponding location, and users by town or city. If you have Google Signals enabled, you may also see data about the gender, interests, and age of your users.
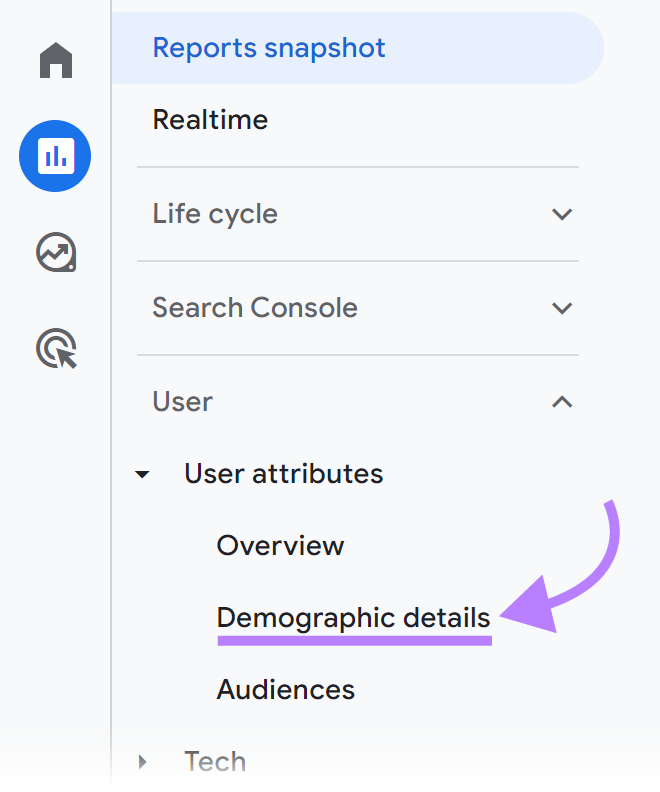
For more details about the engagement metrics associated with users in different locations, click “Demographic details” in the left-hand menu.
This page shows you engagement data with rows for each country your users come from. You can swap this for other user demographic metrics using the drop-down menu at the top left of the table area.
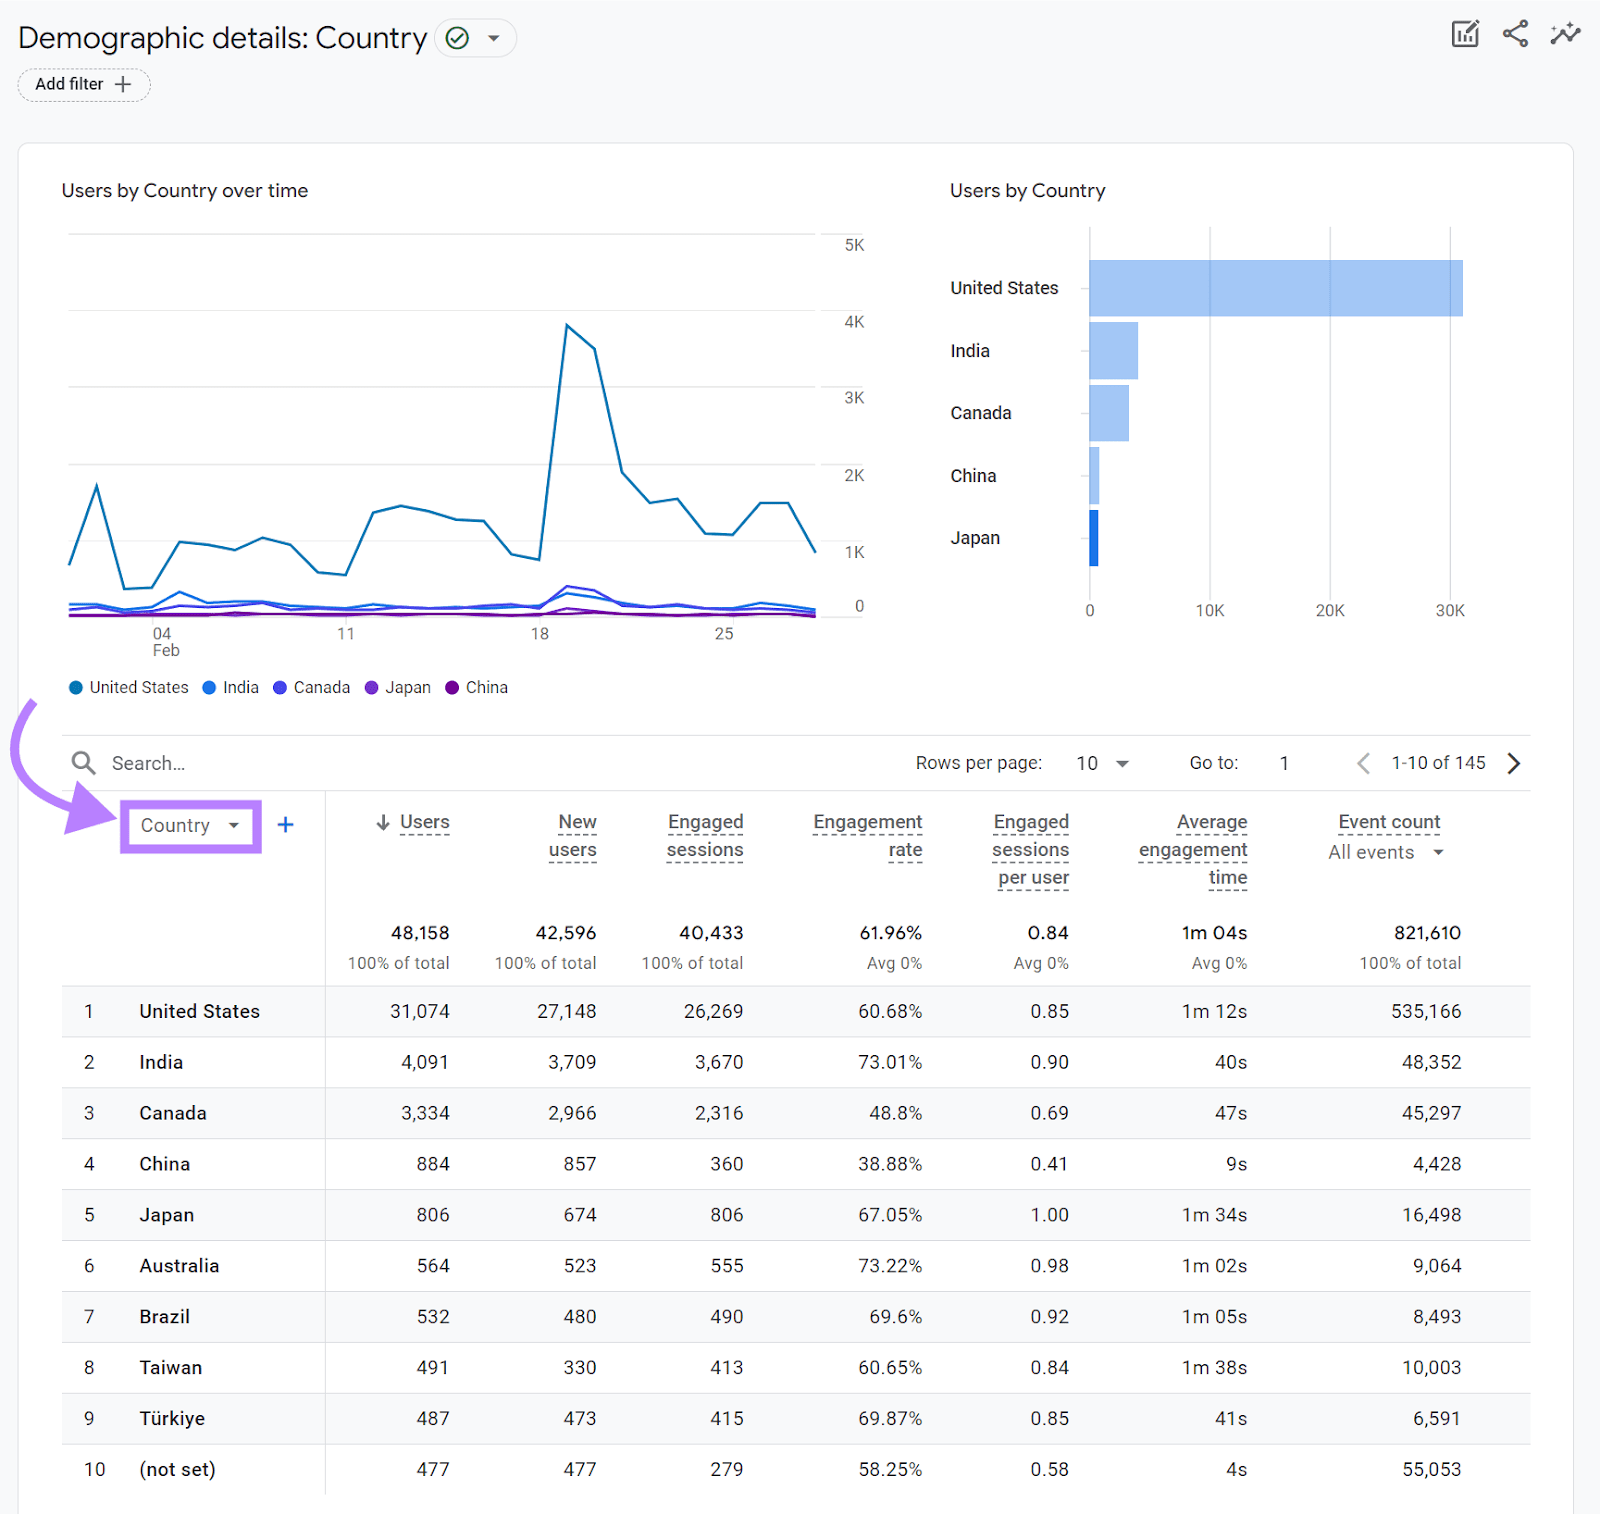
This data can help you understand how well optimized your content is for different segments of your audience. If you notice you’re getting a lot of users from a country that uses a different search engine for example, you may want to look into optimizing for that search engine.
Learn More About Your Users with Semrush
If you don’t want to enable Google Signals, or you just want access to other useful user data, Semrush allows you to easily find out key insights about your users Google analytics won’t provide.
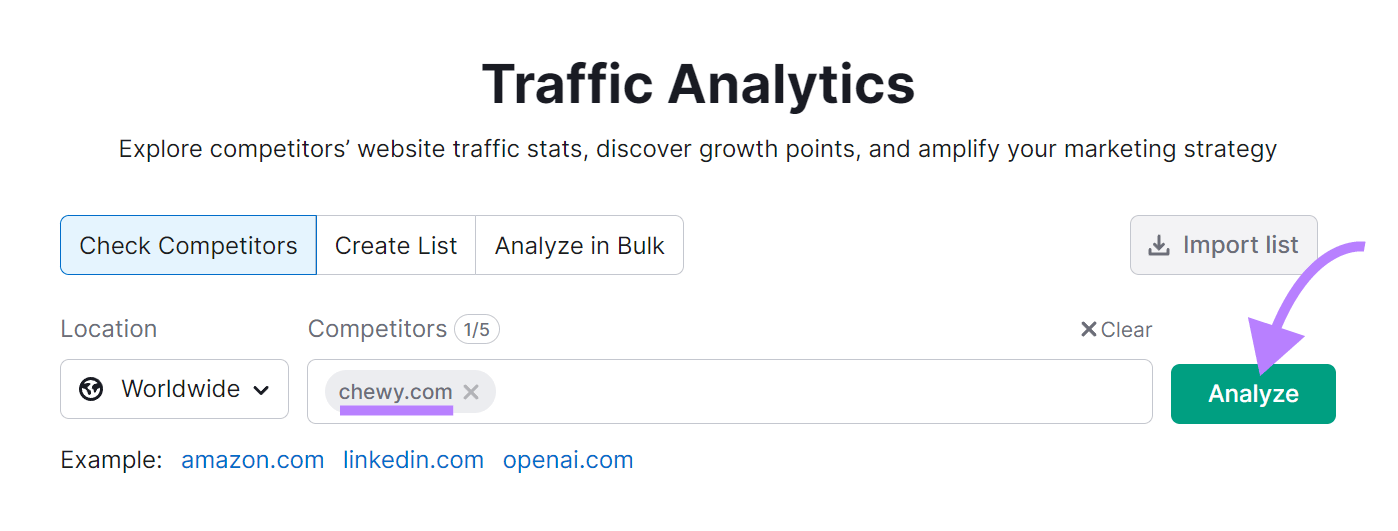
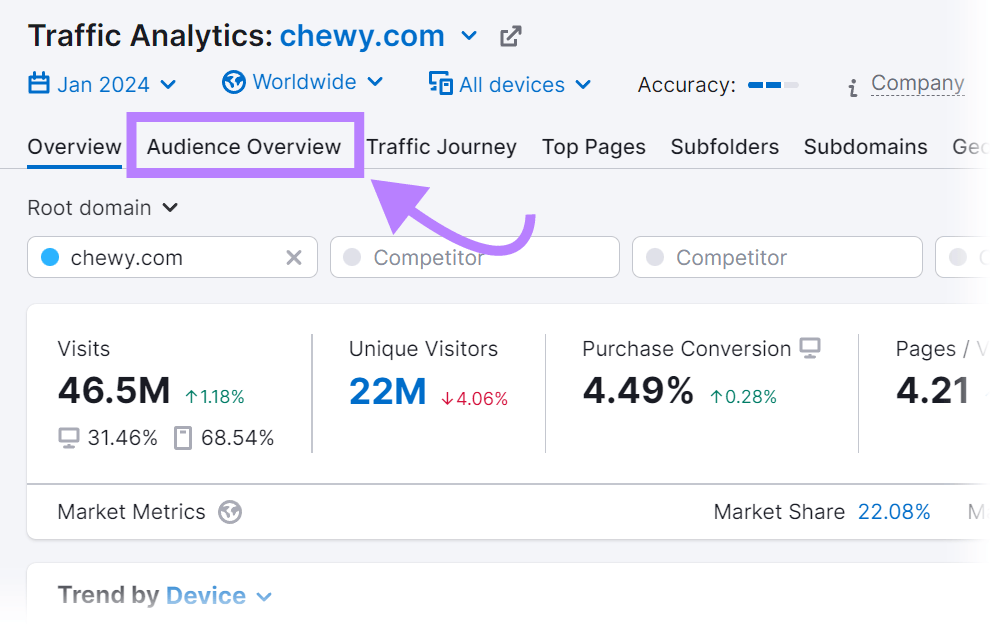
Use the Traffic Analytics tool to learn about your audience’s ***, age, socioeconomics, and more. Navigate to the tool and enter your domain in the search bar, then click “Analyze.”
You’ll notice this tool is typically used for analyzing competitors. But like many other Semrush tools, it’s fairly versatile, and you can still use it to analyze your own website, too.
Click the “Audience Overview” tab at the top.
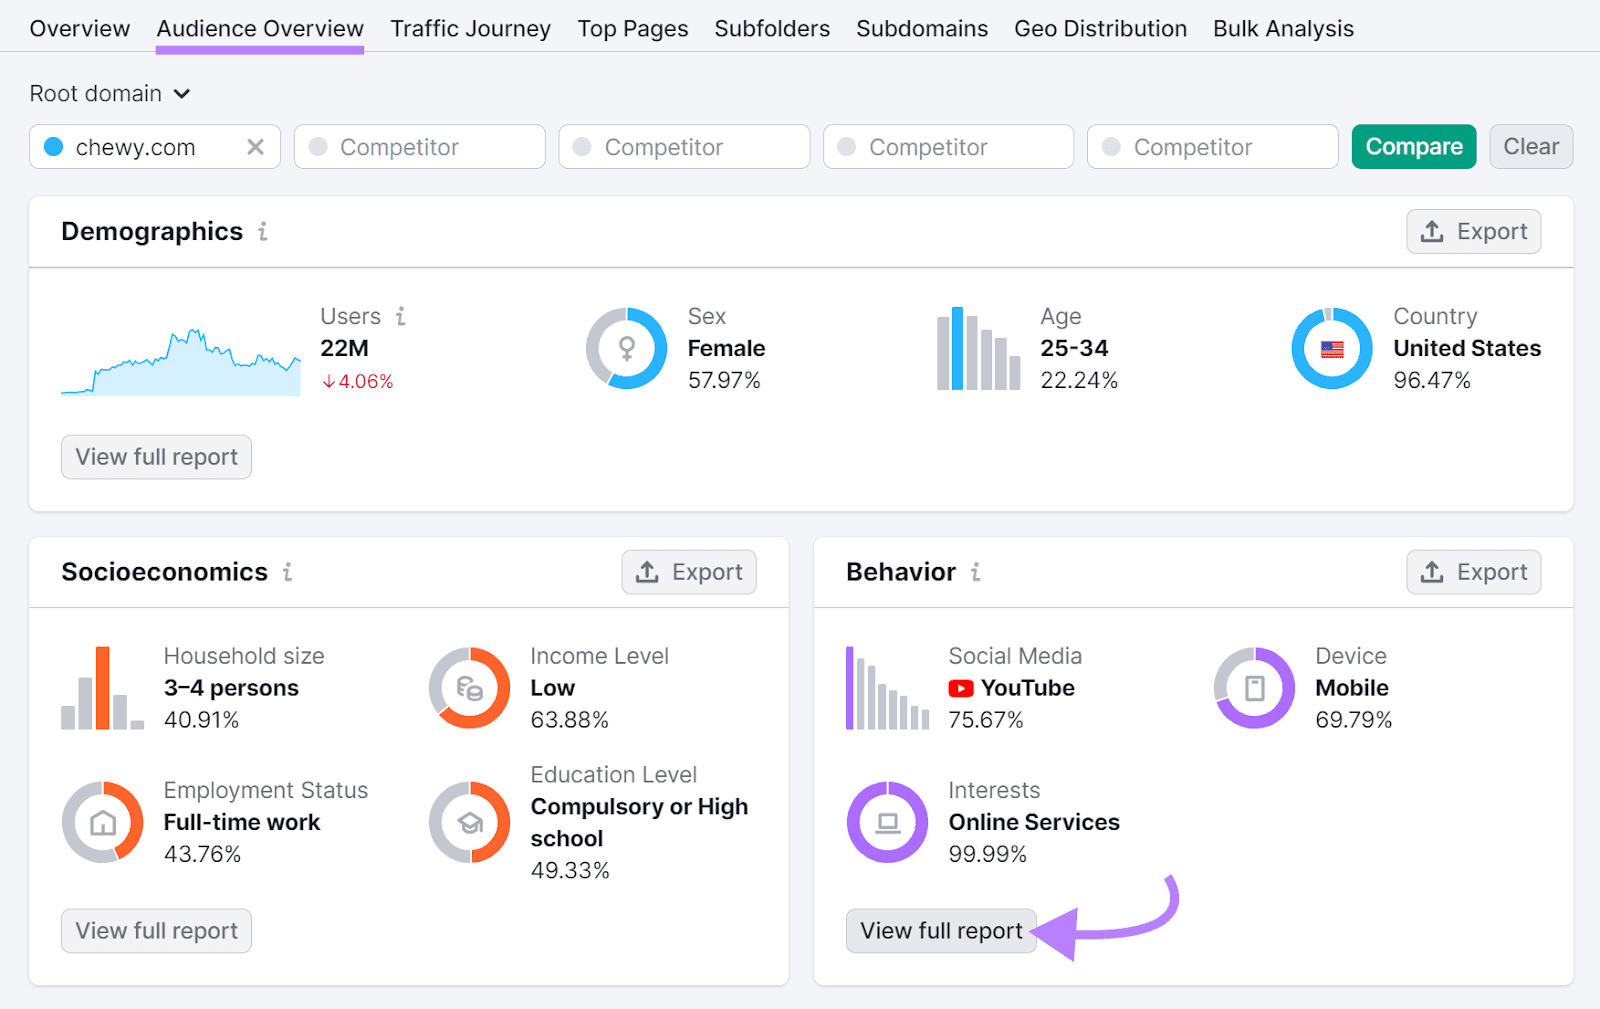
You’ll see data about your audience’s demographics, socioeconomics, behavior, and more. This data can help you better understand your audience and inform your content strategy going forward.
If you click “View full report” in one of the cards, you’ll be taken to the One2Target dashboard with a more detailed breakdown.
For example, in the “Behavior” tab, you can see which social media platforms your users visit most often.
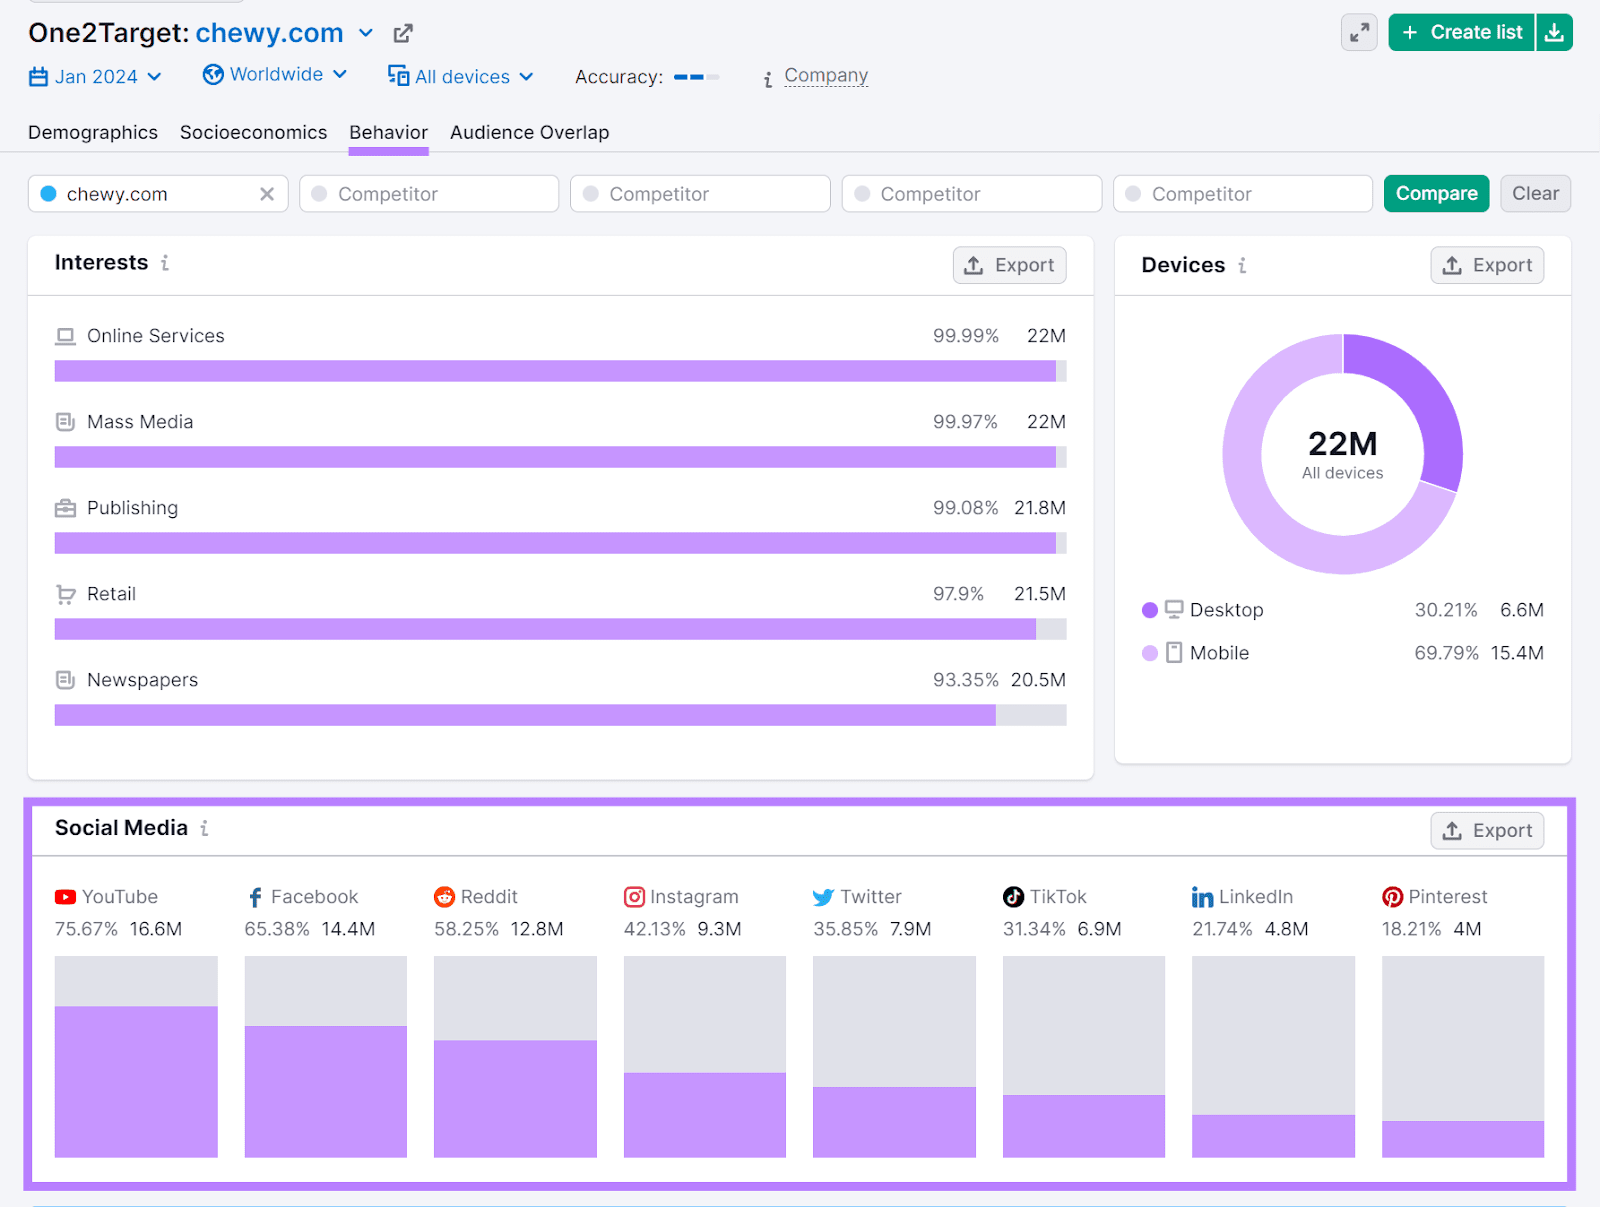
This can help you understand where you may want to focus your social media marketing efforts to better engage with your audience.
Access Traffic Analytics alongside 55+ other helpful digital marketing tools with a Semrush subscription.
Source link : Semrush.com