The key to local SEO data is in its name – it’s local. Without it, a campaign may not receive crucial insights to adjust its central strategy.
If you’re targeting Manhattan, N.Y., but 80% of your users are visiting from devices in Brooklyn, N.Y., you’re missing something. But how do you find these gaps in Google Analytics 4?
Insights previously accessed through Universal Analytics are scattered across several dashboards in GA4, with new processes on the platform for filtering and accessing local data. Additionally, certain settings and configurations must be enabled to ensure local data collection.
A local SEO practitioner should regularly analyze information about organic user locations, behaviors, and landing pages accessed from search results.
Through these key reports in GA4, we can review organic data that reflects key local behaviors:
- Demographic details
- Traffic acquisition and user acquisition
- Landing page
- Library (custom reports)
- Explore
However, none of these reports are perfect. Each report poses flaws and challenges that complicate our data. I’ll include troubleshooting tips and context for each report to ensure the data analysis is as helpful as possible.
A few crucial elements of GA4 impact overall local SEO reporting across these dashboards: the Organic Search filter and Thresholding.
‘Organic Search’ filter
For most reports in GA4, we’ll need to filter to organic search results using the Add filter feature at the top of the dashboard.
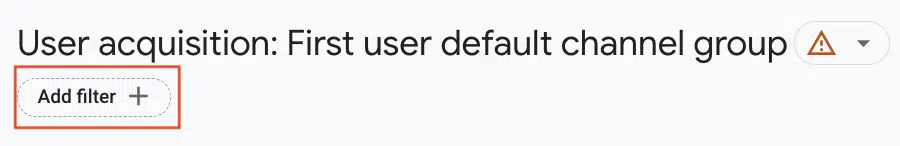
A filter column will appear on the right side of the dashboard.
Depending on whether sessions or users are preferred, we’ll choose Session default channel group or First user default channel group as the filter.
Select exactly matches, check Organic Search, and then click Apply.

This organic filter is used through most of our local SEO dashboards in GA4.
Thresholding
Google’s out-of-the-box reports often apply thresholding, indicating data is a sample.
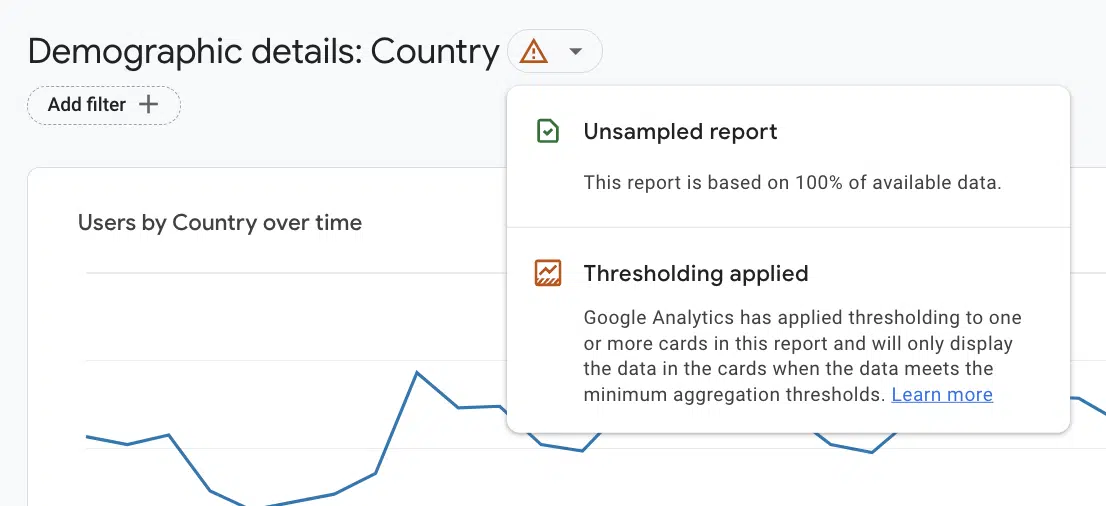
The “Caution” symbol in this report indicates that Google is presenting an aggregate representation of our data rather than exact numbers.
In GA4, data thresholding is implemented across numerous key organic reports to anonymize users’ privacy.
Anonymization usually happens when something can be inferred about the user, like when there’s limited data or if the demographic information about users is too detailed.
For local businesses, individual location pages often receive fewer users since they’re a small piece of the total traffic count.
So, be aware that local SEO data is often an estimate rather than an exact count. We can use this data as a representation of overall user data.
Still, when the difference between compared data sets is >20 users or sessions, we probably shouldn’t rely on it to make major decisions about our strategy.
1. Demographic details
Where to find the data in GA4: Reports > User > User Attributes > Demographic Details
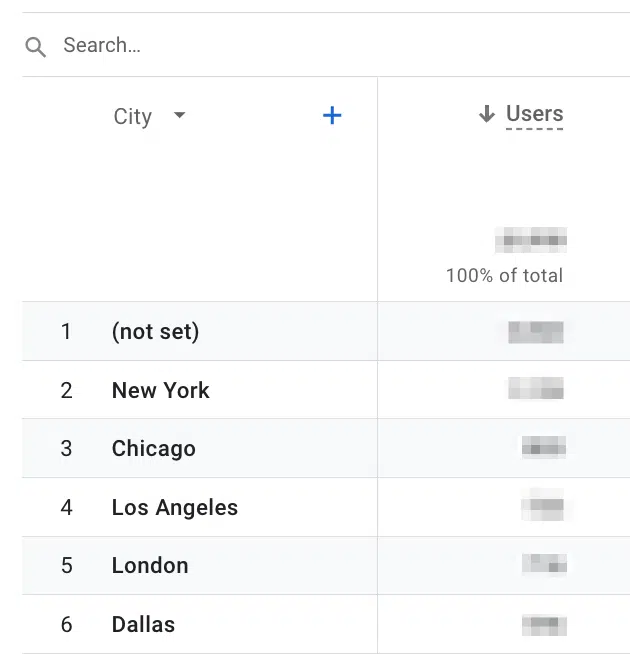
By default, this report lists where users visited by country, but we can change this by selecting the dropdown next to Country, and changing it to Region or City.

From there, we can see the top cities by user:
Why the demographic details report is useful
The demographic details report conveys the region or city where a user accessed the website.
We can compare this user location data with location page traffic or proximity-based rankings in a geo matrix tracking tool.
In the screenshot above, we see that the top cities visited by users in the United States are also some of the most populous: New York, Chicago and Los Angeles.
We should make sure that local landing pages are set up for these locations, as well as key suburbs near these locations.
Issues with the demographic details report
With the right configuration, employee IP addresses will be excluded from GA4 reports, and their cities won’t appear on this dashboard.
However, if employees are required to use a VPN for work, it may prove trickier for the demographic details report to remain accurate. A VPN could anonymize employee data from cities worldwide, scattering location-based attribution.
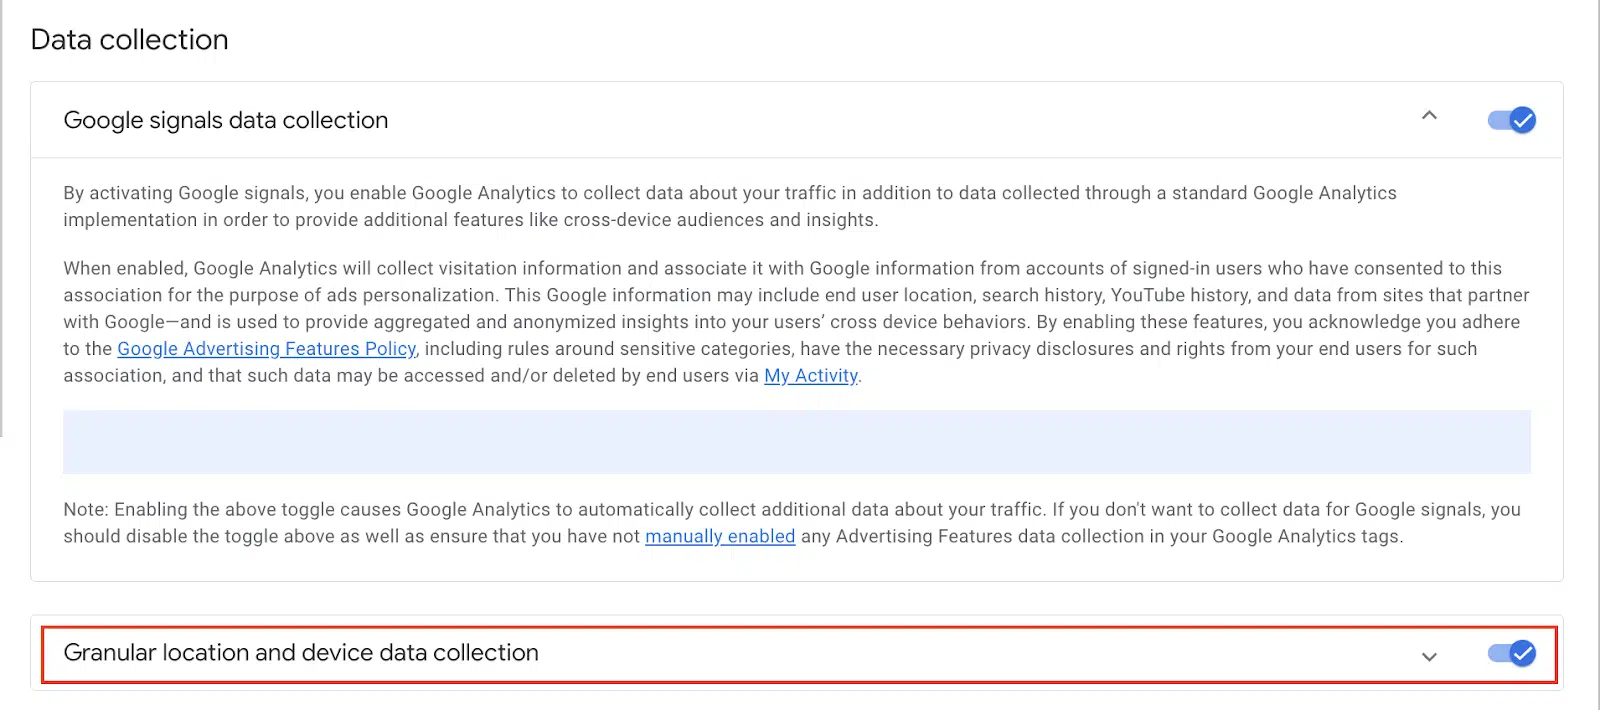
Additionally, certain settings within GA4 must be configured to ensure that the tracking platform is collecting details about a user’s location.
To confirm that user location information is being tracked, visit Admin > Data Settings > Data Collection and ensure that Granular location and device data collection toggle is checked.
As previously noted, the Demographic details report will apply sampling, which means it won’t provide an exact count of users from each location.
Sometimes, these reports may include a row that says (not set), which typically happens because Analytics doesn’t classify the first event on the page as page_view.
An event like user_engagement might trigger prior to page_view, which isn’t supposed to happen but might relate to rendering issues on the website.
Overall, the solution to analyzing (not set) will require time to either configure a custom landing page report or adjust the website’s rendering issues.
These tasks are often high effort and low impact for local SEO unless there are large data discrepancies – i.e., 50% of the reported traffic is (not set).
2. Traffic acquisition and user acquisition
Where to find this data in GA4: There are two types of labeling for this dashboard, depending on whether GA4 was set up before or after April/May 2023:
- Before April-May 2023
- Reports > Life cycle > Acquisition > User acquisition
- Reports > Life cycle > Acquisition > Traffic acquisition
- After April-May 2023
- Reports > Business objectives > Generate leads > User acquisition
- Reports > Business objectives > Generate leads > Traffic acquisition
The Traffic acquisition and User acquisition dashboards both report on the types of marketing channels that drove traffic to the website: organic, paid, social, etc. However, GA4 has split them into separate dashboards due to a difference in data collection:
- User acquisition: Only attributes the first visit from a user.
- Traffic acquisition: Multiple sessions of traffic from the same user.
So, traffic acquisition will include a paid session for a user who clicked an ad one day and counts an organic session for that same user the next day.
User acquisition would attribute the user only to the paid traffic channel because it drove the first visit to the site.
Determining whether we should monitor user or traffic acquisition in local SEO depends on our goals for the campaign.
If we want to know about any time a user visited the site from organic search results, then traffic acquisition is a better fit. However, session-based data becomes complicated with brand and non-brand traffic.
If people find “Tom’s Dental,” as an ad and then visit the site, then they might remember this local business. A few days later, they type “Tom’s Dental,” into search results and click an organic result.
If a volume of users are selecting organic results with a branded search, this may result in an artificial increase in sessions on the Traffic acquisition dashboard.
In these scenarios, relying on the User acquisition dashboard to assess our local SEO growth might be more accurate.
Why the user acquisition and traffic acquisition reports are useful
These dashboards closely resemble the Channels report in Universal Analytics and are a great starting point for determining whether local organic traffic has improved.
In local SEO, data within these dashboards can provide insight around:
- UTM parameters from Google Business Profile.
- Filtering to our location page paths to assess organic traffic.
For simplicity, examples will be from the User acquisition report, but the same filters and adjustments can also be applied to the Traffic acquisition dashboard.
UTM parameters
UTM parameters are added to the end of a business URL in the Website field on Google Business Profile.
For example:
https://example.com/loveland/?utm_source=GMB&utm_medium=organic&utm_campaign=oh-_loveland_gmb_profile
From these UTM parameters, we can assess the success of our GBP profiles with GA4.
Use the dropdown on the User acquisition dashboard to update our dimension from “First user default channel group to First user source/medium.
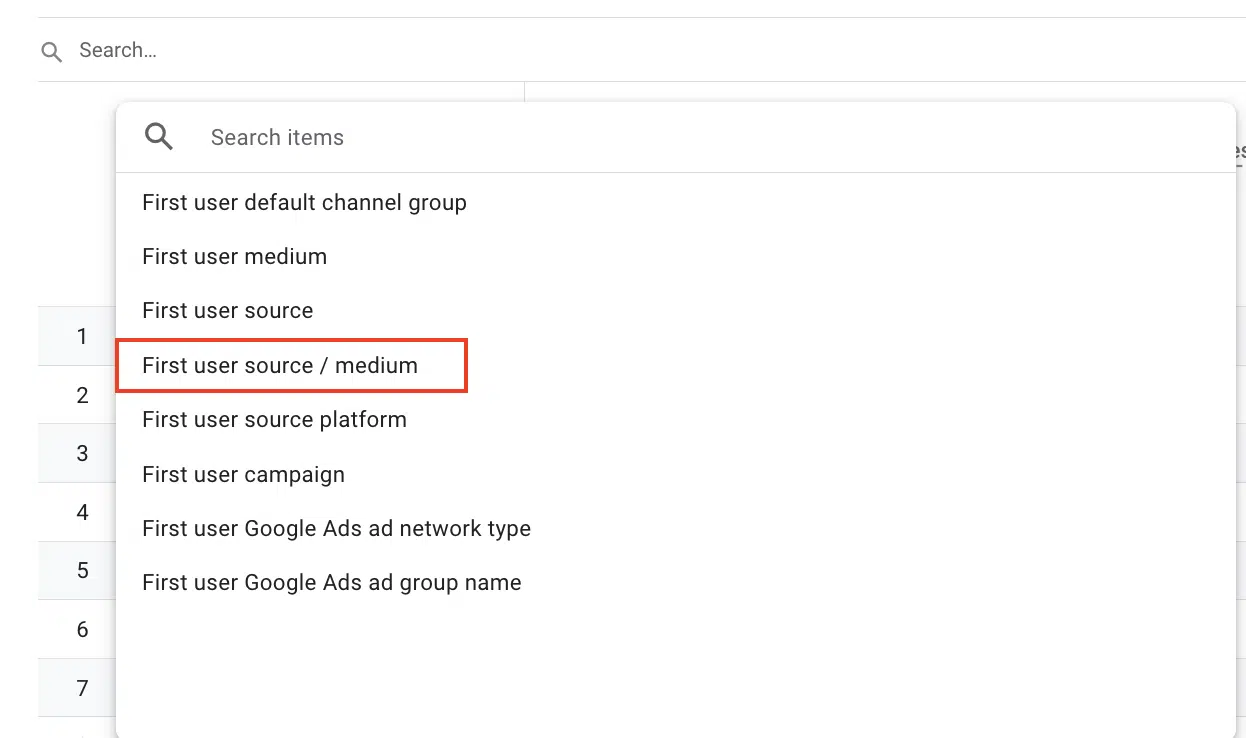
After updating our preferred dimension to First user source/medium, we’ll analyze traffic channels to understand user behavior.
Google Business Profile UTM parameters use source and medium to indicate the type of traffic (medium) and its origin (source).
Here, the website’s UTM was configured like this, with GoogleLocalListing as the source and organic as the medium:

Example:
https://www.website.com/locations/atlanta?utm_source=GoogleLocalListing&utm_medium=organic
Because the source in the screenshot was specified as GoogleLocalListing, we can differentiate standard search results (google / organic) from GBP clicks (GoogleLocalListing / organic).
We see that in a 28-day period, traditional search results received slightly more organic traffic than GBP. This data might indicate that we need to improve our rankings in the Local Pack.
Location pages
By filtering our location pages, we can understand which locations receive the most organic traffic.
Using GA4 to compare the success of our various location pages is crucial to a successful local SEO strategy because it helps us determine priority.
When we have 50 locations but only a few hours to commit across them, it’s most impactful to dedicate our time to the locations most need growth.
First, add a column to the table dashboard that specifies Landing page + query string:

Click the “+” to add a column.
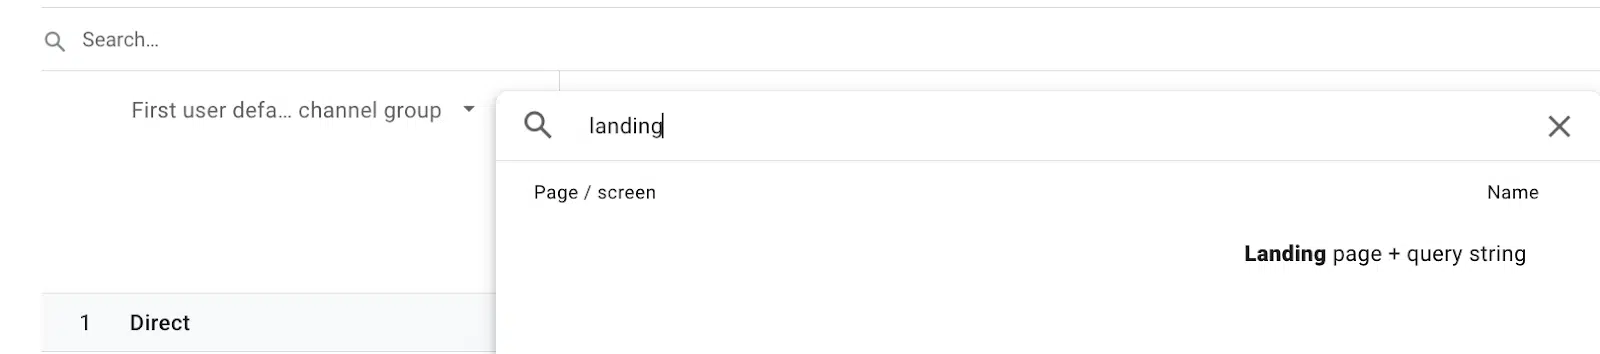
Search for landing page and select Landing page + query string.
Next, use a filter to limit data to organic traffic and our location pages.

Follow the steps outlined at the beginning of this article for filtering organic traffic and add a condition for Landing page + query string to the path of your location pages.
Note: In order to analyze the success of location pages, they must have been organized within a parent path folder, which is typically something like this: https://www.website.com/locations/atlanta
If location pages aren’t nested within a parent path folder, then the Landing page + query string filter won’t work, and assessing local SEO growth will be more challenging.

Based on our filters, we can see that the top GA4 locations accessed by new users are Atlanta and Denver.
Our locations with the least organic new users were New York and Columbus, where we could focus our local SEO efforts moving forward.
Issues with the traffic and user acquisition reports
If you’re not seeing UTM parameters appear within these GA4 reports, confirm that GA4 can display this information by visiting Admin > Data Streams > Redact data.
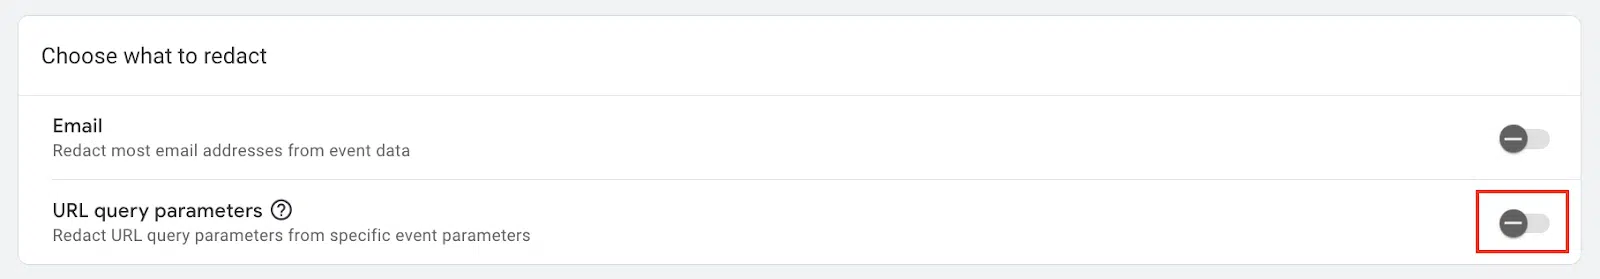
Make sure that URL query parameters is not checked.
Additionally, GA4 sometimes has issues displaying the “campaign” UTM parameters.
If this happens, the campaign listed in the UTM parameter might need to be added as a custom dimension.
Get the daily newsletter search marketers rely on.
3. Landing page
Where to find this data in GA4: There are two types of labeling for this dashboard, depending on whether GA4 was set up before or after April/May 2023:
- Before April-May 2023
- Reports > Life cycle > Engagement > Landing page
- After April-May 2023:
- Reports > Business objectives > Generate leads > Landing page
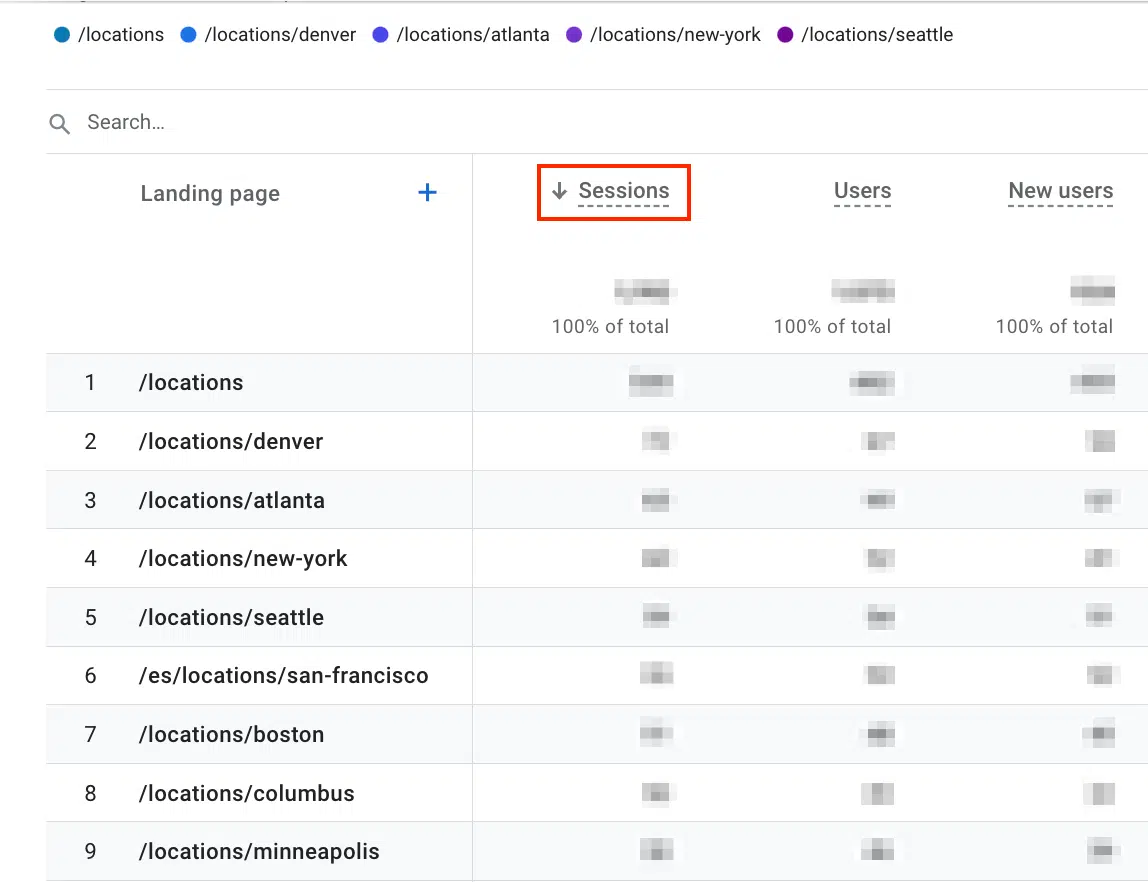
The Landing page report is populated with session data, meaning that a landing page visit is recorded each time a user visits a site after 30 minutes of inactivity.
Why the landing page report is useful
The Landing page report is another way to access location page data, similar to the Landing page + query string filter in traffic and user acquisition.
However, the data in the Landing page report might be slightly different because it’s a set dashboard, so we don’t need to add the Landing page + query string column.
The table on the dashboard automatically sorts by sessions rather than new users.
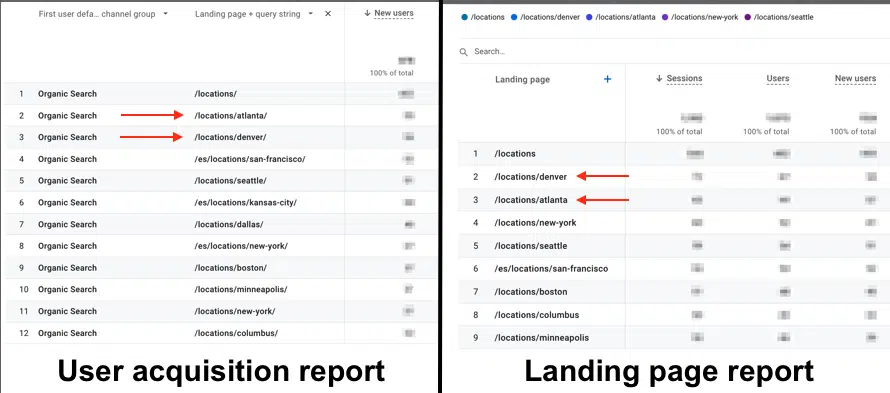
Because GA4 applies thresholding, estimates might vary across its out-of-the-box dashboards, probably because of our filters.
When comparing the Location pages dashboard with the filters in User acquisition, the order of top pages changes, with Denver receiving more sessions while Atlanta receives more new users.
Issues with the landing page report
Google added the landing pages report to GA4 in December 2022. Before this, GA4 users had to build a landing page report manually.
If your website’s GA4 account was configured prior to December 2022, then the Landing page report might be missing.
Additionally, the out-of-the-box landing page report for these older GA4 accounts might conflict with a manually built landing page report.
4. Custom reports
Where to find this data in GA4: When working with any out-of-the-box report in GA4, click the Edit icon in the upper right corner of the dashboard to configure a custom report.
After setting the filters as desired, click Save and give the report an appropriate name.

To review custom reports, navigate to Reports > Library on the lower left part of the dashboard.

Why custom reports are useful
A user saves time by accessing the custom report rather than applying these filters every time GA4 is accessed.
Each out-of-the-box report explained in this article can be saved as a custom report. Here are some examples of what these might be called:
- Users in California Cities
- GBP Users
- Sessions by Local Landing Page
- Organic Location Pages
Ultimately, the custom reports filter is great if you regularly reference the same data within a set **** range.
Issues with custom reports
The **** range for a custom report cannot be changed. Data in a custom report will appear based on the selected **** range when the report was first created.

If the **** range is set as “Last 28 days,” then then last 28 days of data will always appear in the custom report.
So, if a custom report should reflect year-over-year organic traffic growth, then be sure to select Compare prior to saving the report. If a new **** range is needed, you’ll have to build a new custom report.
Additionally, custom reports cannot be exported. Any of GA4’s out-of-the-box reports can be exported by clicking the Share this Report icon on the upper right portion of the dashboard, which can then be downloaded as a PDF or CSV file.

Based on these limitations, custom reports in GA4 seem to be designed as an ongoing reference, rather than a troubleshooting or deep analysis tool.
5. Explore
Explore is designed to address deeper GA4 questions that cannot be answered with an out-of-the-box report. It is less of a dashboard in GA4 and more of a data platform – each Explore report is a custom configuration.
For example, Explore is useful if we want to pull a report comparing demographic location data to our organic location pages.

In this example, we see that some users are visiting the website from Honolulu, HI, but there is no Honolulu location page on the website.
This data suggests Honolulu might fit our next location page well.
Combining demographic data with landing page data can give us deeper insights into the campaign’s next steps.
Dozens of reports like the example above can be pulled with Explore using the principles of the out-of-the-box reports. Still, these configurations are advanced and require additional time to learn the GA4 platform.
Uncover key local SEO insights using GA4
Overall, the out-of-the-box dashboards in GA4 can provide valuable insights for our local SEO campaigns. Here are some examples of questions we can answer with this local data:
- Does my site need more location pages?
- Which location pages need additional optimization?
- Which GBP’s are driving the most organic traffic?
- Is keyword growth for a location page driving traffic?
While GA4 is a useful tool for gathering these insights, we should not depend on it as our sole source of data.
Local SEO data from GA4 should be contextualized with other reporting data from Google Search Console, GBP Insights, geo-matrix tracking tools, and other keyword reporting platforms.
For example, if we see an increase in GA4 organic sessions for a location page, is this because of ranking growth or an increase in branded queries?
We can’t determine the source of growth until we cross-reference why users visited the page.
The new GA4 platform includes plenty of insights for our local SEO campaigns as long as we understand the greater context of our wins and losses.
Opinions expressed in this article are those of the guest author and not necessarily Search Engine Land. Staff authors are listed here.
Source link : Searchengineland.com