
Posted by
Mordy Oberstein
We often discuss the stability of rank, of sites on the SERP. However, SERP features have their own significance to the SERP and to SEO. Whether you score or compete with SERP features, it behooves us to know how stable they are. How consistent is Google with its SERP feature showings? Which features tend to display at consistent levels from one month to the next? Which features are subject to heavy amounts of display fluctuations?
This is your comprehensive look at SERP feature stability, volatility, and consistency. This is your look at SERP feature fluctuations in 2018!

How to Calculate SERP Feature Volatility
Being that this is not your average set of metrics, let me just take a few moments to elucidate how I calculated a SERP feature’s “consistency.” The issue in making such a determination is that SERP features tend to fluctuate. Any given feature can suddenly spike up and then just as suddenly show at even lower levels. This tendency towards sudden movement makes it hard to take a feature’s display level for a specific moment in time and utilize it to highlight its overall stability. In real terms, this precluded simply taking a feature’s display levels at the end of a month and comparing it to the display level of the following month.
To circumvent this problem, I took three data points from each month in both 2017 and 2018 in order to create an average monthly display level for a given SERP feature. I then calculated the deviation from month to month using the averages. The result is a more accurate and less erratic data-set. With this, I took the standard deviation of each feature from 2017 and compared it to its deviation in 2018 (for both mobile and desktop, except in the case of AMP where desktop is not relevant).
Also, before moving on, I want to point out a limitation in the data. A change in a SERP feature’s display level does not necessarily mean the feature is more volatile or less consistent. It is entirely possible that the standard deviation of a given feature has increased due to the feature becoming increasingly prevalent on the results page. In such cases, I will be sure to indicate as such.
And lastly, let me more clearly define what I mean by SERP feature display level consistency and fluctuations. SERP features do not show on the same percentage of SERPs from one day to the next and certainly not from one month to the next. There’s a constant shift in the percentage of SERPs a given feature appears on. The question is, how drastic are these changes? Is a given feature more consistent? Does it generally appear on the same percentage of SERPs or does its display level change significantly from one month to the next?
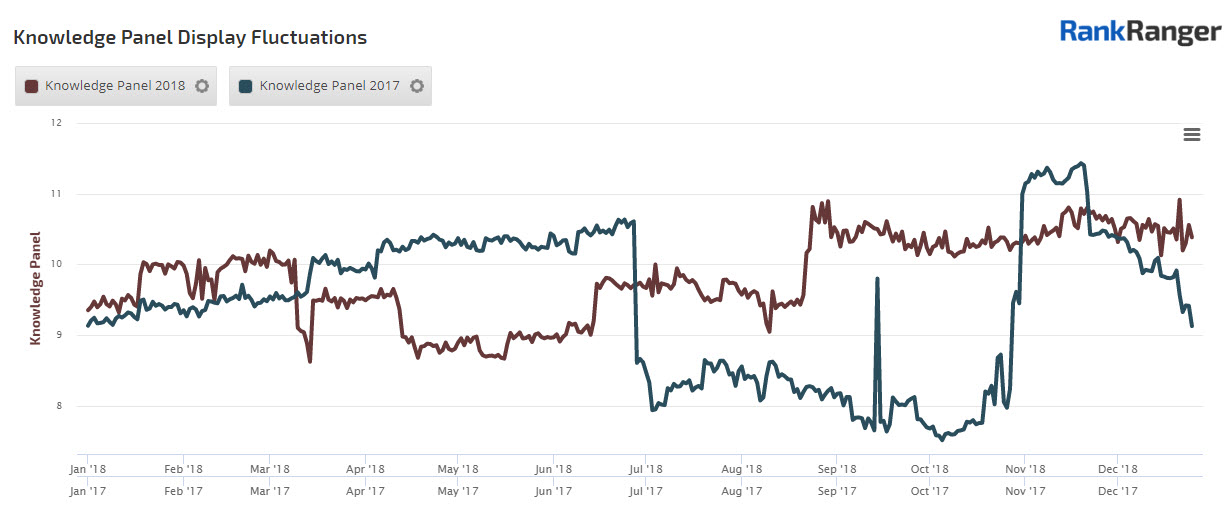
Knowledge Panel display level changes for both 2017 and 2018 show the feature to be constantly showing on a varying percentage of SERPs
SERP Feature Consistency – Why Does It Even Matter?
I usually save this for after a look at the data. Here, however, due to the nature of the subject-matter and the fact that it’s not a topic often discussed I elected to start off with ‘the why’. Knowing if a particular SERP feature fluctuates more often than others or more than it has in the past is valuable for a few reasons.
1) For starters, knowing a feature’s propensity to oscillate between showing for more/fewer keywords helps you understand its overall reliability. If one day you wake up and you no longer have obtained a certain feature for some of your keywords, it won’t come to you as a shock. More than that, it may help you from driving yourself nuts trying to regain what you lost as you’ll understand that the feature simply tends to ebb and flow.
2) Now, as I alluded to above, a feature can present itself as having a less consistent display level because Google has sent it on a new data course, one that sees large upticks from one month to the next. Knowing this can tell you if the feature is ripe for the taking as Google now prefers it more than it had in the past.
3) There are certain SERP features where assessing their “stability” has its own unique value. Google Ads or PLAs would be the clearest case. Knowing that Google shows an ad property consistently or inconsistently gives you a general sense of what value you might be able to obtain via ads. Seeing that Google Ads tend to fluctuate up and down with there being more ads one month and less the next can help you qualify the overall potential your campaigns will have. Of course, each and every campaign is different as Google relates to all sorts of keywords a bit differently.
4) Lastly, and perhaps most importantly, tracking SERP feature consistency is a path towards being clued-in as to how often or to what extent Google recalibrates the way it goes about showing a certain feature on the SERP. Looking at the swaying display levels of numerous features helps to paint a picture of how active Google is in refining its SERPs and in the age of machine learning points to how energetically the search engine is altering its understanding of user intent and subsequently what meets user needs.
It should go without saying that these are not the only reasons for looking at the consistency of SERP feature display levels. It should equally go without saying that any particular keyword niche or a specific set of keywords may show totally different trends than what the data shows to be happening in aggregate.
Are Google’s SERP Features More or Less Consistent than in the Past?
The first batch of features I examined are some of the SERP’s most important elements, the SERP’s heavy-hitters if you will. In specific, I looked at the changes in the display levels for:
- Local Packs
- Featured Snippets
- Related Questions
- Knowledge Panels
- SiteLinks
While there were many other features I could have studied I chose these due to their overall impact on a user’s search experience. This is why I chose to include SiteLinks, which are not only a very helpful feature but one that often occupies a large amount of space on the SERP.
Let’s then start off by looking at SERP feature fluctuations on
SERP Feature Frequency on Desktop
Looking at the data for the aforementioned features on
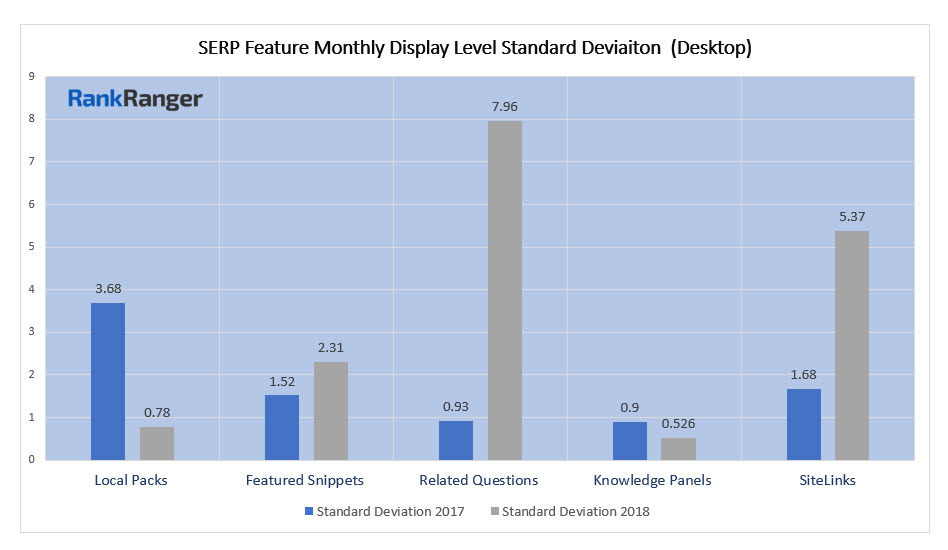
Both Local Packs and Knowledge Panels were extremely consistent in 2018 with standard deviations below 1. Though, Knowledge Panels on desktop were as such in 2017 as well. Excluding those two features and the rest of the fray saw high amounts of display level volatility with SiteLinks and Related Questions both showing a standard deviation over 5.
However, that is not to say that there were oscillations in opportunities to score either feature. Rather than swaying between higher and lower display levels the increased deviation for both SiteLinks and Related Questions is mainly due to Google’s proliferation of the features in 2018. This is most clearly seen with Related Questions which went from showing on circa to 15% of page one SERPs at the start of 2018 to around 35% by the year’s end. SiteLinks behaved similarly, though here, while there was a general move towards a higher display level there were some significant back and forths along the way.
It’s also worthwhile to note that Featured Snippets broke the 2 point mark in 2018 and followed the same path as Related Questions in showing a greater “spread of data” in 2018 than in 2017. This does make sense as Google often pairs the two features together.
Mobile SERP Feature Display Level Consistency
Despite the vast differences between the devices, the data tracked on mobile is not entirely different than what was seen on desktop. Though, there are a few noticeable differences.
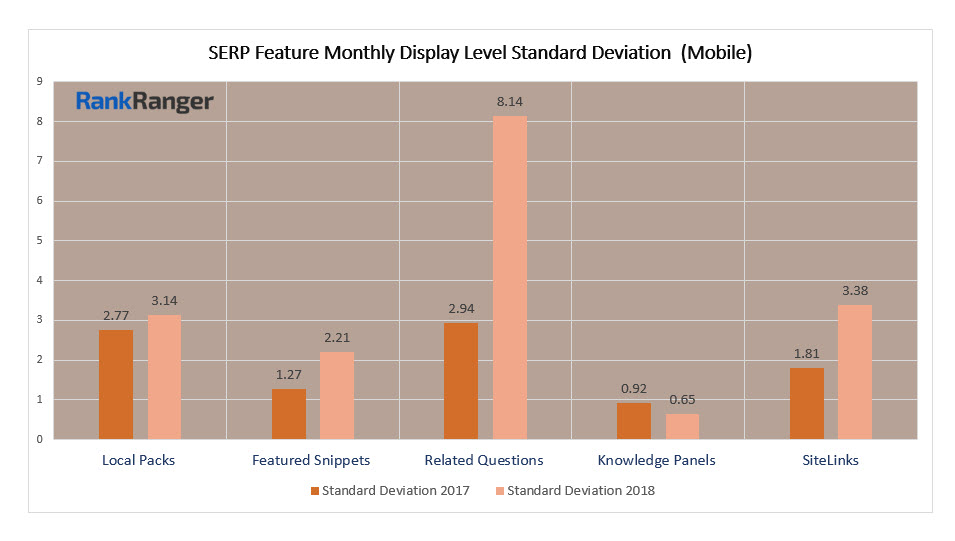
In terms of device variance, Local Packs on mobile were significantly more erratic in their display levels in 2018 as compared to their desktop counterpart. It should be said, that such was not the case in 2017 where desktop Local Packs had a higher standard deviation. The 3.14 deviation seen for the mobile Local Pack can be attributed to a general increase in the feature’s presence on the SERP, with some notable spikes coming towards the end of the year where the feature jumped from showing on 39% of SERPs to 43%. While there was a general increase in the feature’s presence in 2017, the uptick was far more gradual. This then is another case where the broader data spread did not mean less consistency per se.
The other features
Knowledge Panels seem to be the one constant here. Just as with desktop, mobile Knowledge Panels became slightly more consistent in 2018 falling well below a standard deviation of 1.
Were Google Ads and PLAs Stable in 2018?
Moving over to the paid elements on the SERP there is some striking data both for ads and for PLAs, but for different reasons. For this, a quick glance at the data is all you need. Here, let’s begin with mobile since Google seems to prefer the device when paid elements are concerned:
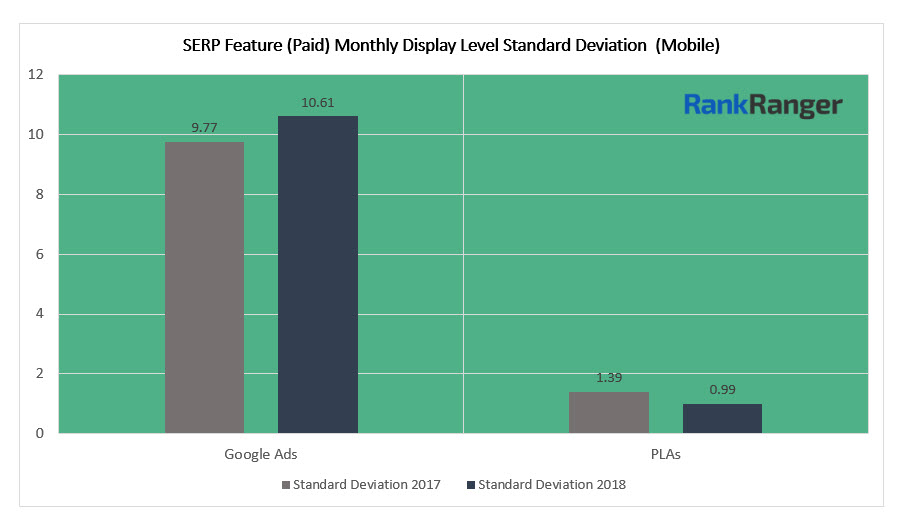
The level of “volatility” that ads show is astounding. Until now, Related Questions had the most significant “mobile” standard deviation (8.14) from month to month (again, using the monthly averages discussed above). In 2018, Google Ads had a month to month display level deviation north of 10!
Ads on the SERP, Google Ads to be specific, are incredibly volatile. In fact, I would call them the poster child of SERP feature volatility. Google Ads undergo a lot of ups and downs on the SERP and that’s something that is not new to 2018 as the desktop data for 2017 shows the same. Unlike a feature such as SiteLinks, the swaying display levels Google Ads undergo is not related to Google upping the feature’s overall frequency. Ads simply swing to greater and lesser levels of SERP placement.
PLA consistency on mobile is no less notable, though this stems from their stability rather than their volatility. Compared to their Google Ad sibling, shopping ads on the SERP were quite stable with a standard deviation in 2018 that fell below 1 (not that PLAs were highly volatile in 2017)!
Now, this is where it gets intriguing, at least vis-a-vis Google Ads – desktop!
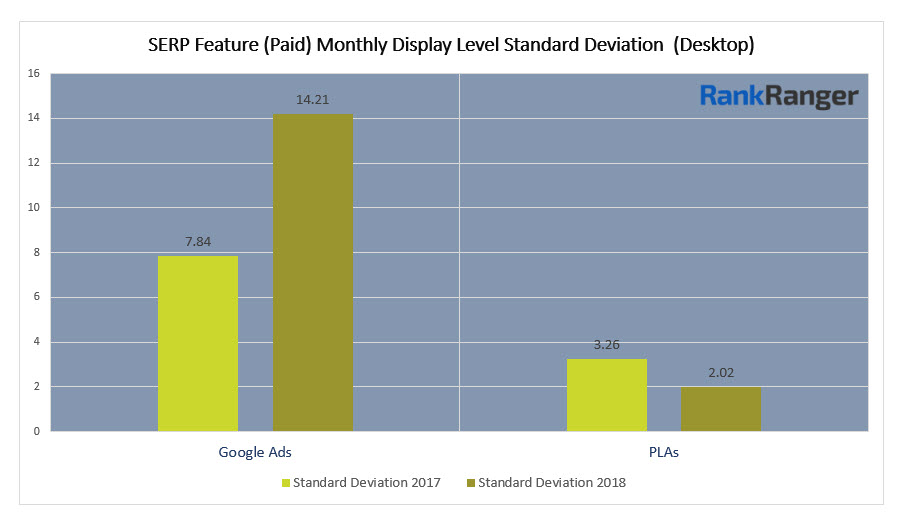
While on mobile, Google Ads showed high levels of SERP display movement from month to month (hence the large standard deviation) in both 2017 and 2018, such was not the case on
Further showcasing the extent to which mobile is a different ad environment than desktop, which it certainly is, PLAs on
AMP Display Level Consistency in 2018
AMP has always piqued my curiosity. It’s just something that has this aura of controversy and is, of course, the subject of much debate. With Google trying to push/promote AMP adoption I thought it would be interesting to see how “the AMP dynamic” plays itself out in terms of its consistency among the organic results.
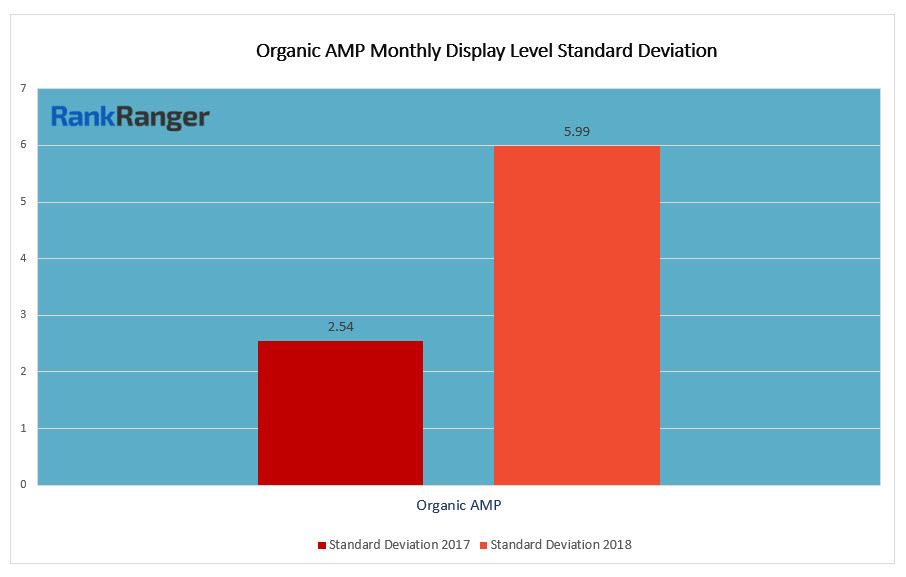
Well, here it is. 2018 was far more “unpredictable.” In terms of hard numbers, 2018 saw a 135% increase in organic AMP’s standard deviation. True, part of the larger shifts from month to month came as Google gave organic AMP a boost during Q4 of 2018, taking the feature from showing on approximately 25% of page one SERPs to roughly 35% of page one SERPs. Still, much of the increase is attributable to greater display swings.
What makes this interesting is the possible reasons behind this. Are sites both adopting and abandoning AMP? Does Google adjust AMP levels algorithmically (i.e., is AMP a ranking factor)? Is it just a case of coincidence with AMP sites moving in and out of query relevancy (as I only looked at page one AMP results)?
Where We Stand with SERP Features and Their Display Levels
It behooves us to quickly recap where we stand with each of the SERP features analyzed here only because there was just so much data. I’m going to simply go through each feature and succinctly summarize its display level consistency. In certain instances, this will also offer us the opportunity to further explore some of the features less discussed above.
Local Packs: A stream of increases in its SERP presence drove Local Packs to a standard deviation that was above 2.5 to the exclusion of 2018 on
Featured Snippets: On desktop and mobile this feature has become slightly more consistent in 2018. Despite all of the attention they garner, Featured Snippets are one of the more consistent SERP features, at least according to their display levels, with a standard deviation that hovers a bit above 2.
Related Questions: For the most part, the driving force behind a standard deviation of 7.96 on desktop and 8.14 on mobile has been Google’s push to place the feature on far more SERPs than in 2017. Just to highlight the change, on
Knowledge Panels: Both on desktop and mobile, Knowledge Panels showed an increased consistency on the SERP. Truth be told, they were already pretty stable. On
SiteLinks: In 2017, SiteLinks was one of the more stable and consistent features on the SERP. However, with Google increasing the presence of SiteLinks on the SERP, both on desktop and mobile, its standard deviation jumped considerably. As the feature proliferated, it underwent a series of dramatic spikes that spread its monthly average around a bit. Though, at the same time, there were a few “reversals” which saw the feature see-saw a bit as its presence was increased. This added some inconsistency to the feature’s display levels for both mobile and desktop.
Google Ads: Though being a bit less volatile on mobile than on desktop, the display level on the SERP for Google Ads is far from consistent. Indeed, in 2018 its display levels were even less stable than in 2017. Unlike Related Questions and SiteLinks, Google Ads were truly volatile and inconsistent with display levels that oscillated anywhere from a 30% monthly average to one north of 50% (desktop).
PLAs: In strong contradistinction to Google Ads, PLAs are one of the more consistent elements on the SERP. in 2018, there was no more than a 2 point differential in the average monthly showing for PLAs. While Google Ads is relevant for a wide range of advertising categories, PLAs are strictly shopping ads. It would seem that the clear “intent mission” of the PLA leaves it in a more consistent SERP position.
AMP: The large increases to organic AMP has driven the feature’s standard deviation over 5. Now, this is not to say that the jump from a 2.54 deviation in 2017 is solely due to Google throwing more AMP on the SERP. Both Q1 and Q2 saw organic AMP’s display levels sway back and forth. For example, there was a 3 point loss between March and April. Such instances were not the case in 2017. Once July came around, however, AMP underwent a few data spikes that further accentuated its standard deviation.
Intense on Intent!

In all honesty, it’s not surprising to see a general increase in SERP feature fluctuations and changes. All you have to do is look at how Google has altered the very features themselves: filter bubbles in Featured Snippets… a new hybrid Knowledge Panel/Featured Snippet… a barrage of changes to hotel Local Packs and Local Panels. Google is targeting users in all-new ways with its SERP features. It aims to fill more search intents with them than ever before. From that perspective, seeing Google up the display level of one feature while constantly adjusting
About The Author