
Posted by
Mordy Oberstein
Way back in May of 2017 I presented a bit of data on how a Google algorithm update impacted some of the biggest names in online retail. What I had shown then was merely a snapshot in time, the result of one of Google’s many updates. Since then, a little birdie informed me that not all is well with big-time retailers on the SERP. How then have the major eCommerce sites fared on the Google SERP over the long haul? Rumor has it that some of the biggest players in online retail have suffered majorly in the rankings in the recent past. A notion, that as it turned out, is quite true
…. Let’s have a look at the data for e-commerce and all-around retail juggernauts, Amazon, Walmart, and eBay.
Amazon’s Average Rank Descends Amid Increased Retail Volatility
To begin this journey, and to determine if indeed Google has shifted how it treats the most prominent names in online retail, I compared Amazon’s, Walmart’s, and eBay’s average rank for the last half of 2016 (more accurately from August 2016, up to and including January 2017) to the same period in 2017 (and 2018, i.e. January).
At this point you could guess the results, because if the average rank did not increase in 2017, why would I write this post (and why would I say as much in the heading you just read)? So what then does the data specifically show?
Here it is:
![]()
The most notable data tidbit here is that Amazon saw its results shift down an entire position (on average) when comparing the data from August 2016 – January 2017 to that of August 2017 – January 2018. (It should be noted that this comes during a period where Google has revamped its product search strategy at the expense of Amazon.)
At the same time, you might think that Google has relegated its change in treatment to Amazon and only to Amazon. That is, the average rank shown between the data periods for both Walmart and eBay didn’t change much. If anything, their average rank slightly improved. But that’s not really the whole story.
Increased Monthly Average Rank Fluctuations
Sure, the average rank for Walmart and Amazon may be about the same during both the August 2016 – January 2017 and the August 2017 – January 2018 data periods. However, that doesn’t tell you how stable these sites really are. All we know thus far is that the average over the course of both periods, when all was said and done, was pretty much the same. What we don’t know is the nature of the path these sites took to arrive at similar average ranks for both periods.
That’s why I want to take a look at the average change in average rank from month to month:
![]()
What you see above is the change in average rank from one month to the next, per site, per data period. Following this sequence is the average of all of these changes. Meaning, the average change in average rank from one month to the next per data period (and of course per site).
What does this data then tell us? Well, simply, it tells us that the rank for these sites is more volatile than it used to be. For example, eBay used to see its average rank fluctuate .272 rank positions per month. Now, eBay’s average rank shifts .5 positions each month. That’s an 84% increase in rank volatility (Walmart behaved similarly with an 82% increase in volatility).
Again, it’s interesting to note that Amazon performed along a different trajectory than the other two sites. While Amazon saw a large shift in its average rank between the two data periods, such was not the case when looking at the month-to-month change. That is, Amazon’s average rank fluctuations presented a period over period increase of 23%. Which is dramatically lower than the changes we saw
for Walmart and eBay, who both hovered around the 80% mark.
Shifts in Average Number of Positions Changed
To further accentuate how things have changed for these retail sites over time, let’s have a look at one final metric (for now), the Average Positions Changed. This metric tells us the average number of positions the site fluctuated (up or down) across all of the keywords we tracked for it. To arrive at this metric we look at where a site ranked for a given keyword at the start of the month and where it ranked by month’s end. We then, of course, calculate the difference in position and then average that number into the same data for other keywords. The result is the average number of positions the site has fluctuated over the course of the month across all tracked keywords.
What does this metric tell us? Well, let’s take Walmart. As mentioned earlier, Walmart’s average rank didn’t shift much from one data period to the next. However, the changes in average rank from month-to-month during the second data period (August 2017 – January 2018) were significantly higher than those during the previous period. As we said above, this meant that while the end result, i.e., the average rank was relatively consistent, the path Walmart’s site took to that end number was more volatile. How much more volatile then? Enter the Average Positions Changed:
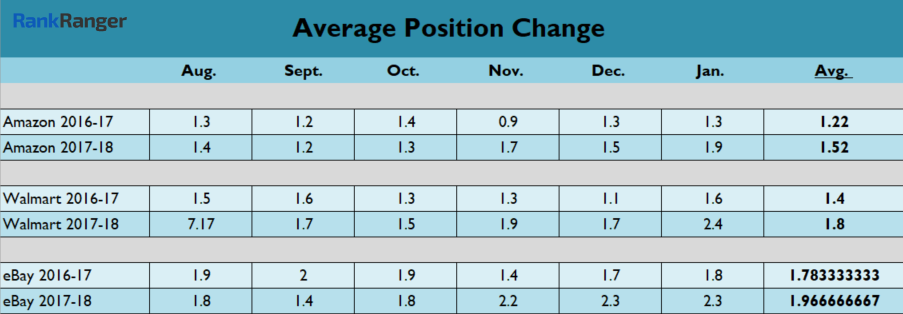
Let’s break down what we have here. Each of the sites, to varying degrees, has shown an increase in the average number of positions changed across their tracked keywords. At first glance though, the difference in average position change from one period to the other doesn’t seem that striking. Is Amazon’s increase from 1.22 positions on average to 1.52 that big? Well, yeah.
Here are the differences from one period to the other as a percentage increase for each site:
Amazon: 25%
Walmart: 29%
eBay: 10%
In the context of analyzing how Google currently “treats” these sites, relative to the past, a 25% increase in the average number of position changes each month is significant. That’s a lot more shifting, a lot more rank volatility, and if it were your site, you would not be happy.
I want to point out, that our sub-theme of Amazon being on its own trajectory doesn’t apply here. Like Walmart, the site underwent a considerable increase in position fluctuations during the second data period (eBay as well, but to a lesser extent).
Where Things Stand at This Point
Let’s just take stock of where we are with the data we’ve looked at thus far. So two things really emerge:
1) The rankings for the retail sites studied here are more volatile than they were previously. This considers the fact that Walmart’s and eBay’s average rank did not change drastically between the two periods. However, as we’ve seen, upon digging a bit deeper, the ranking shifts that occurred within that average, or that comprised their overall average rank, were significantly more volatile during the second data period.
2) Amazon stands out in how it has been impacted by Google’s algorithms. Like both eBay and Walmart, the site’s average position change significantly increased during the second data period. However, unlike the other two sites, Amazon saw an enormous shift in its average rank during the second data period (where the site lost a full rank position). Meaning, Google has changed the ranking trajectory of big-name retail sites. However, within this data path, Amazon stands alone with its own unique and more drastic “sub-trajectory.”
Going Deep into Retail Site Rank Changes
At this point, we know that retail sites have seen a significant increase in rank volatility. However, what’s the overall impact of that volatility? Meaning, at this juncture things could go either way (except in the case of Amazon where we know its average rank has decreased by a full position). Sure, Walmart and eBay have shown greater rank volatility. And yes, that is inherently problematic. Just consider trying to “win big” with certain pages for specific keywords with Google constantly shuffling your pages up and down the SERP. That said though, what we don’t know is “where” this volatility exists, and if we don’t know “where” it exists, we don’t know the real impact. For all we know, these increased fluctuations have given Walmart and eBay a boost in the rankings.
As an aside, I want to point out that the data we’ve seen brings up an interesting scenario. Say your overall rankings have increased on average, but are more volatile, is that a good thing (overall)? I would say
not, since ranking is not really your goal, conversion is, and it’s hard to create a sound conversion strategy when the pages that comprise that strategy are all over the place.
My personal SEO wisdom aside, let’s go deeper into the rank volatility we’ve already seen these sites undergo. To do so, I’m going to show you data on the percentage of keywords each of the sites studied rank for in the first, second, and third positions for both data periods.
Retail Site First Position Ranking Data
Who, if any, are the winners or losers within this new retail ranking reality? Meaning, what is the actual impact on visibility and potential traffic? Nothing tells this story better than seeing how the sites studied have shifted in terms of their top ranking propensity.
Below is the data, for both data periods, showing the percentage of keywords within each site’s dataset that ranked in the top position on the SERP:
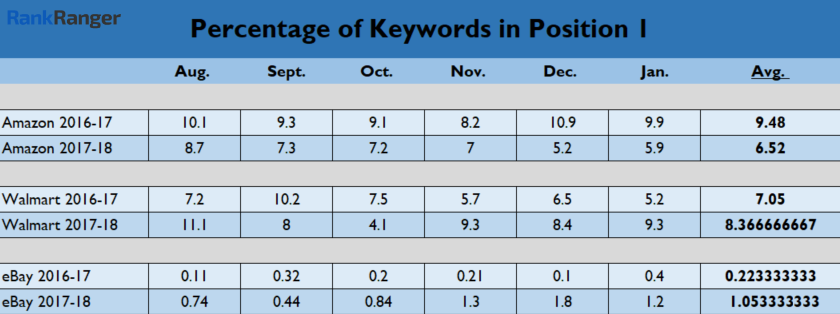
Simply put, whatever it was that has shifted over at Google has had a deep impact on Amazon, and that’s an understatement. 9.5% of Amazon’s keyword dataset placed in the top result during the first data period. Between August 2017 and January 2018 that number was just over 6.5%, a 32% loss. Think about what that means
from a visibility, traffic, and subsequently conversion perspective.
On the other hand, Walmart and eBay both did better vis a vis ranking in the #1 spot on the SERP. Walmart saw a 16% increase in the number of keywords that brought up a top result for its site, while eBay saw a massive 377% increase. To be fair, eBay is not much of a top ranking spot “player” as even during the second data period, only 1% of its keywords produced a top ranking eBay URL.
Thus, as is clear, unique ranking patterns have emerged among the sites and will continue as we move along. Which brings us to our next metric, the Percentage of Keywords in Position 2.
Retail Site Second Position Ranking Data
Moving to the 2nd position on the Google SERP and Amazon’s ranking woes continue :
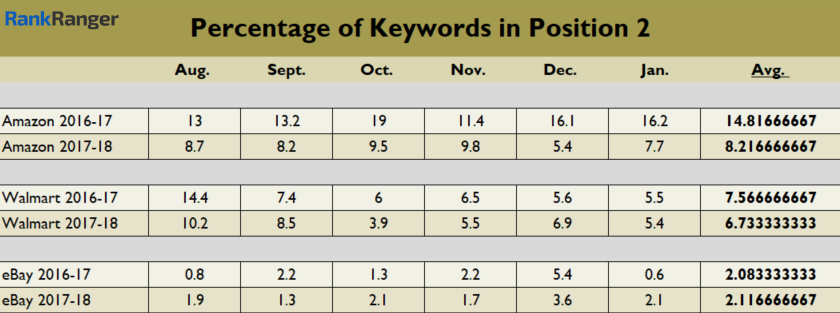
Again, Amazon suffered huge losses, moving from having nearly 15% of its keywords showing in the second position on the SERP to just over 8%, a 44% decrease. So now we have Amazon showing massive losses in both the first and second positions on the Google SERP.
Moving on to Walmart, and we start to see that not all of the fluctuations we noted earlier were for the best, as their keyword set presented an 11% decrease in the 2nd position when comparing the data periods. Not a huge number, but not a small one either.
Looking at eBay, and the site saw a relatively negligible 5% increase in the percentage of their keywords appearing in the second SERP position.
Retail Site Third Position Ranking Data
Lastly, below is the data on how the sites performed in the third position on the Google SERP during both data periods:
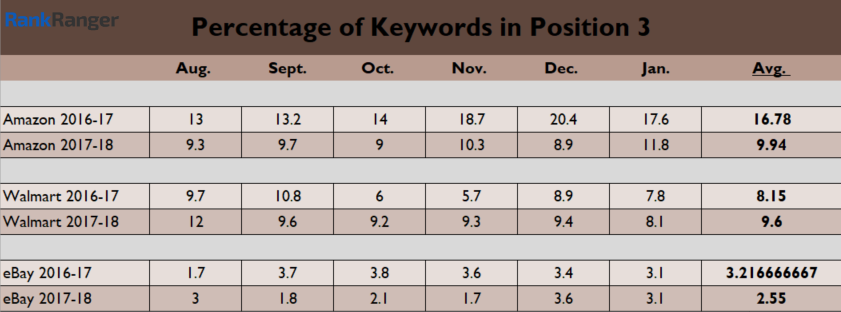
It’s been a hard stretch for Amazon, and at this point, there is a clear pattern showing that Google has demoted the site. When comparing the two data periods, Amazon has seen a 41% reduction in its third position keyword set. At this point, we know that these third position results have not moved up to the first or second slots on the SERP (i.e., logically speaking it would be possible for the position 3 keywords to move up to positions 1 and 2). Meaning, it’s an all-around loss for the site.
For Walmart, all things considered, things don’t look too bad from a rank perspective (again, volatility has been horrific across the board, and is perhaps more significant than position data). The site saw an 18% increase when looking at the third position. If I was a ******* man, I would say that a lot of these new “position 3” keywords came from the second position, where as noted above, the site saw an 11% decrease.
When looking at this metric, eBay joins the rank loss fray having its third position showing a 21% decrease when comparing the two data periods. It could be that some of these keywords actually moved up to the first position, though, and as I mentioned, eBay has a very limited showing in the top position regardless of
data period.
Where Things Stand at This Point
Well, it’s abundantly clear, Amazon is the big loser in the era of retail site instability. That is, within the trend of greater retail site volatility, Amazon has suffered both stability and actual ranking losses. And while both Walmart and eBay were subject to the new trajectory that is increased retail site volatility, their actual rankings were more of a mixed bag. Specifically, both Walmart and eBay saw position one keyword percentage increases, while showing decreases in other positions. As noted, it is possible that these position decreases were partly the result of keywords actually moving up the rankings. In fact, looking back at the average rank data shown earlier, this does seem like a legitimate possibility (since average rank did not change between periods in any significant way).
What’s important to keep in mind though is that any ranking increase exists within a dynamic that is substantially more volatile than the past has traditionally been.
Part of a More Volatile Google Algorithmic Environment
I want one thing to be abundantly clear, the increase in rank volatility shown here is not limited to retail sites. In other words, I am not trying to expose the unique rank volatility that exits within the online retail universe. Rather, I am presenting here what is behind the volatility within this specific niche. Rank has become significantly more volatile across the board. All I’ve done here is to show how that volatility has played itself out within this industry (and that Amazon has been hit hard in the rankings).
To tie this all up nicely, let’s take a quick look at the change in rank volatility trends within the niche discussed here as compared to other niches.
One of the most significant metrics I looked at in this study was Average Position Change. Here is the Average Position Change for the Home & Garden niche, which includes many of the keywords I analyzed in this study:
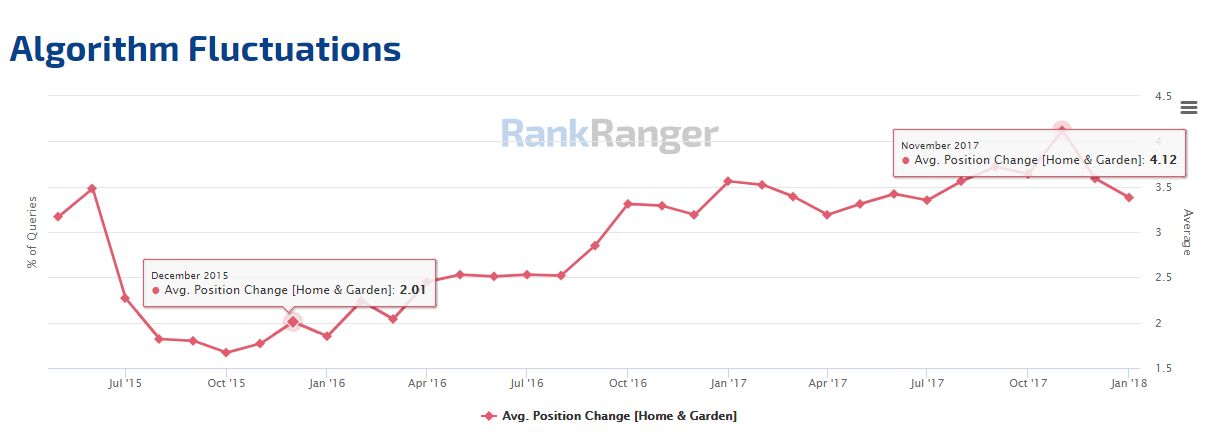
As you can clearly see, the Average Position Change within the niche has doubled since the summer of 2015.
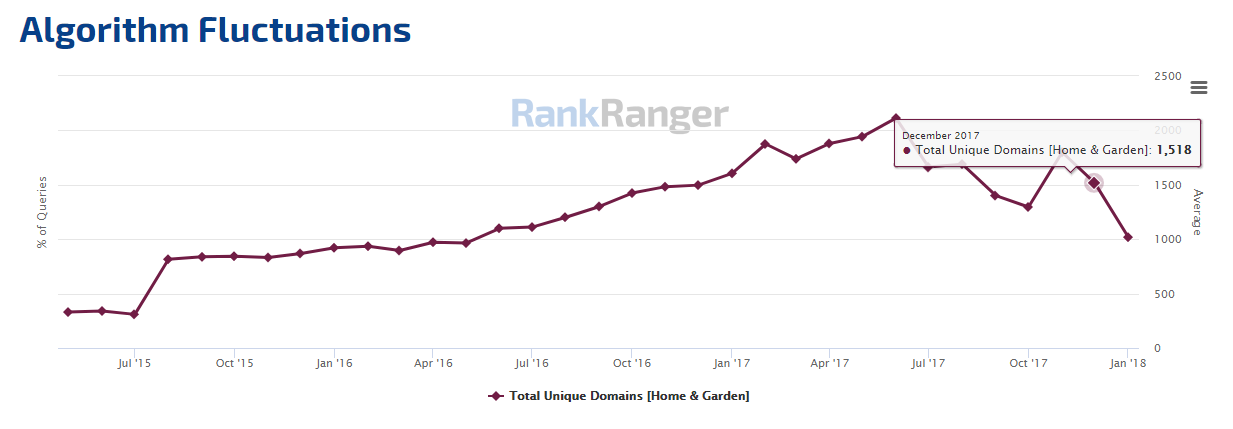
Complimenting this, we can also see that Google has greatly increased its preference to show results from a variety of domains. Looking at the same niche, you can see that the Total Unique Domains has also doubled since the summer of 2015:
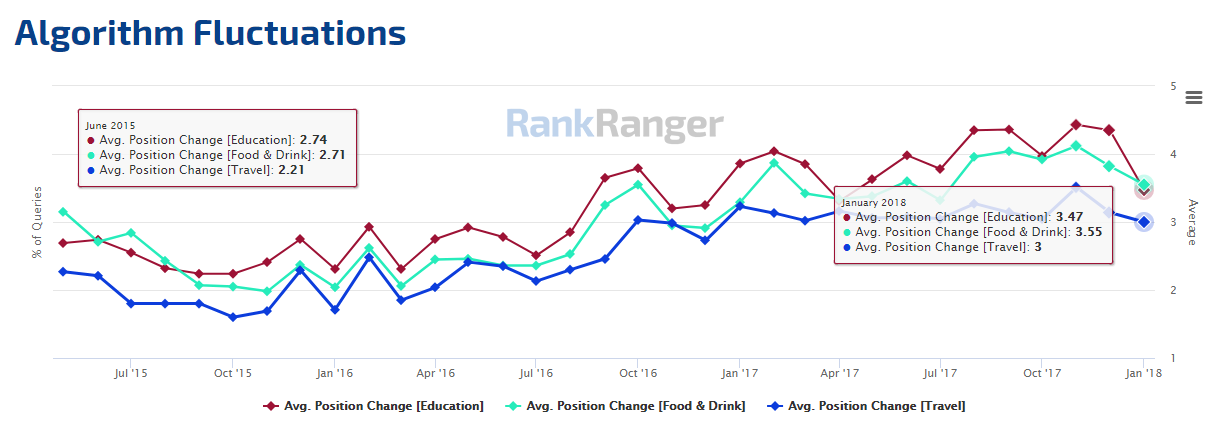
You can see the pattern exists for the Travel, Food & Drink, and Education niches as well. Here’s the data for the Average Position Change metric for those niches:
The same pattern presents itself within these niches for the Unique Domains metric:
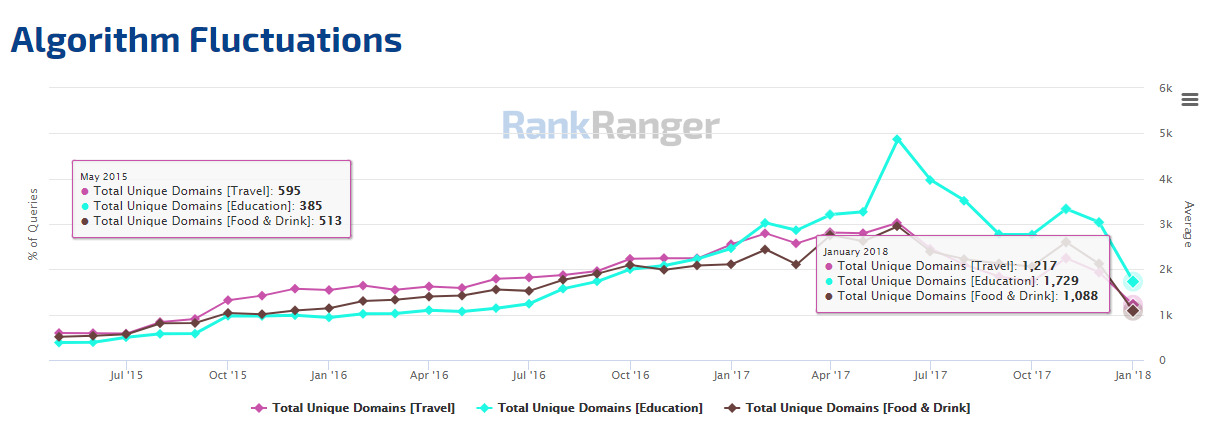
Two things of note here:
1) The increases are just enormous. Just by way of example, the number of unique domains we tracked within the Travel niche increased 140% while the average position change increased by 48% between May 2015 and January 2018!
2) There does seem to be a bit of a trend towards greater rank stability that has manifested itself since the fall of 2017. What is the likelihood that this will become the new rank trajectory? All things being equal, not that great. However, it is worth noting that there has been a recent shift and it could be that a new rank stability trajectory is emerging.
A Bit
on the Data Collection Process
I don’t think it’s fair just to throw information at you without discussing what’s behind the data as well as some of the limitations of the study undertaken. First off, I did not analyze thousands upon thousands of keywords. Rather, a set of about a thousand keywords was used in this instance. It should also be noted that most of the keywords came from the Retail and Home and Garden niches.
As such, the data here is not an exhaustive representation of an exhaustively voluminous set of
keywords, but is better construed as a patterned snapshot. Meaning, it is a micro representation of the broader keyword performance of these sites, all things being equal.
Don’t Sell the SERP Farm – What the Data Means for Retail Sites
The above data is not apocalyptic, nor does it spell the end of SEO. On the contrary, the data above indicates that
commerce related queries produce a more diverse set of search results. Meaning, if you are not Amazon (or the like), the current trends could work in your favor. That’s not to say that smaller retail sites (smaller relative to Amazon) don’t experience ranking volatility. It would appear that the average site certainly does, as indicated by the Average Position Change data shown above. However, search result diversity does give sites a seat at the table when they would have otherwise been kicked to the curb.

It’s this volatility that I personally think makes this such a complex “ranking environment.” It’s great for “smaller” sites to have a seat at the table (if you happen to be such a site), but how are you supposed to capitalize on a seat that only has three legs? Meaning, if the entire ranking environment is quite unstable, how can you properly execute an effective SEO strategy?
Fluidity. Fluidity is how to effectively execute an SEO strategy in today’s world. The days of coming up with a monolithic SEO blueprint are long over. How do you deal with a volatile rank environment? You accept it for what it is and develop a roadmap that is versatile, that does not hinge on a rigid set of factors. Simply, your approach should become as diverse as the environment you find yourself in. In this instance, that means an ever-shifting focus. It means a continuous reevaluation of your priorities and methods as they relate to focusing on organic traffic, paid search, social media marketing, and so forth.
In other words, don’t sell the organic SERP farm, just plant some fields around it that you can pick from when the time comes. Happy planting.
About The Author