
In Power BI, Top N and Bottom N are often displayed using a visual level filter and two visuals, respectively. As a result, we can only show one item at a time on top or bottom N. But, if the situation asks for slicer selection to be used to dynamically change how top and bottom N are shown in a single visual at simultaneously. DAX can help us accomplish this scenario. Let’s look at how we can visualize this situation.
Steps:
1.Create measure like total Quantity to display total number of orders.
Total Order = COUNT(order details[order_id])
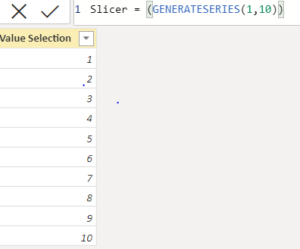
2.create a table and generate series in that table by using the below Dax which will be used for slicer selection.
Slicer = (GENERATESERIES(1,10))
3.Now create measure which will be used on visual level filter to display top and Bottom N both in a single visual at same time.
Top Bottom =
Var TopX= SELECTEDVALUE(Slicer[Value Selection])
Var TopRank= RANKX(ALL(pizza_types[name]),CALCULATE(‘Calculations'[Total Order]),,DESC)
Var BottomRank= RANKX(ALL(pizza_types[name]),CALCULATE(‘Calculations'[Total Order]),,ASC)
Var Result=
SWITCH(
TRUE(),
TopRank<=TopX,1,
BottomRank<=TopX,-1,
blank())
return Result
Explanation: In the above measure
- In TopX we are taking the values which are there in column which we created for slicer selection.
- In TopRank we are giving rank to pizza names and their Total number of orders in Descending order
- In BottomRank we are giving rank to pizza names and their Total number of orders in Ascending order
- Then in Result we are putting the Condition that if TopRank is less than or equal to TopX then give result as include and if BottomRank is less than or equal to TopX then give result as include else give blank
- Then we are returning the Result
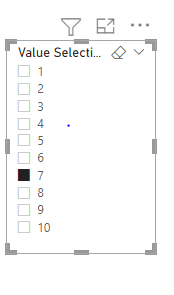
4.Now place column in slicer from the table in which we generated the series.
5.Now take bar chart on canvas and drag total orders in value section and pizza names on X-axis and Place Top Bottom measure in Visual level filter, select is not blank and apply filter

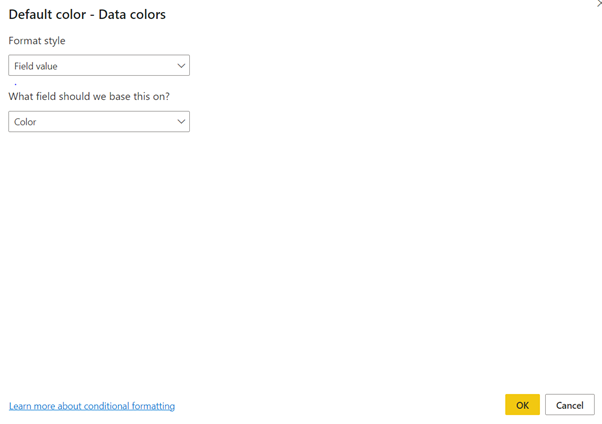
6.Now we want top display top orders in green and bottom orders in red then we can give conditional formatting to the visual. We need to make a measure place it in data color function.
Measure:> Color = SWITCH(TRUE(),
‘Calculations'[Top Bottom]=1,”#43E114″,
[Top Bottom]=-1,”#E13014″)
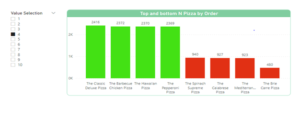
That’s how we can display top and Bottom N both in Single Visual at a same time in Power BI.