Posted by
Tzvi Barish
Most SEO professionals know the ins and outs of the trade – that content is king, that technical SEO optimization is a must, and that you can’t get serious rank traction without quality backlinks. The thing is, that succeeding as an SEO agency is not just about knowing SEO, it’s about understanding how to manage the client relationship, a central part of which is knowing the right way to prepare SEO reports.
Before we can set out to understand the “how to report” question, we need to ask a much more basic question: what do we hope to achieve by sending our clients SEO reports? Well, the popular (and insufficient) answer is that we send out reports to clients to let them know what we’ve done and how their SEO campaign is performing, i.e., to keep them up to ****.
The problem is, if we’re just telling our customers about what we’re doing and showing them a bunch of data, that doesn’t necessarily show the value of the services we’re providing.
SEO Reports Need to Reflect
Your Agreed Upon Goals

In order to demonstrate the tangible value of the SEO services we provide to our clients, we need to first clarify what they would like to achieve with their online presence. Most likely, savvy customers will be able to easily spell that out, whereas others will need more information and some guidance before they can decide on their specific goals. Once the goals have been defined, the next step is to agree upon certain metrics that will signal that we’ve successfully achieved their goals.
Setting agreed upon goals is a crucial part of meeting and exceeding your clients’ expectations. My father, who worked for years as a successful financial consultant, loves to use the following metaphor to drive home the importance of clarifying expectations with everyone you do business with:
“Imagine you’re holding two pieces of paper”, he says. “One piece of paper represents what you’re aiming to achieve, and the other one represents your client’s goals. The more the papers overlap, i.e., the more your vision of what ‘success’ will look like converge, the greater the chances that your client will be satisfied with your performance. On the other hand, the less the papers overlap, and the more your expectations are divergent, you may think you hit it out of the park, but from the client’s point of view, you didn’t even reach first base.”
With this in mind, you need to engage your client right from the outset in order to find out what their goals are. You may need to help them to determine concrete targets, and you can do so by offering them some examples of goals such as:
- Increasing leads
- Growing online sales
- Building up free trial sign ups
- Driving phone calls
- Boosting traffic to the website
- Expanding brand awareness
Once you have the client’s buy-in into the goals, your reports can focus on which goals were achieved and what progress was obtained towards achieving those goals yet to be obtained.
SEO Reports Need to Focus on the Big Picture
After the goals have been set, we can now proceed to the central topic at hand and that is how to report on our results. The general rule

As the old saying goes, “the devil is the details.” Well, aside from the idiom’s usual meaning, it could be said that providing your customers with too many details may be the work of the devil…
Including tables with hundreds, or even “just” dozens, of keyword rankings in your reports just because your SEO program tracks them, is not a good practice. The client is not going to hunker down over a thick sub sandwich and a cold beer at the end of a hard work day to excitedly look through all those reams of data.
That’s why every SEOer has to have a clear dichotomy in their head between the detail-laden reports which serve them to analyze and monitor keyword rank and those top-level reports which are built to communicate and show value to clients.
Providing data in tabular form is not taboo by any sense, but remember that you should be providing a report that focuses on goal achievement, and thus, since you cannot concentrate simultaneously on optimizing for 200 keywords (not to mention 2,000 keywords), don’t include voluminous tables, they don’t impress anyone. They just turn people off from reading your reports.
So a table of 10-30 keywords accompanied by a short summary of the progress made is totally legit, but remember, you’re reporting, not doing a data dump…
No Boilerplate Reports, Pleeeeease
It’s a great idea to set up informal templates that you’ll use to create SEO reports for your clients, but it’s important to be aware of the different knowledge levels your clients may have, as well as their degree of sophistication and even attention spans. One size (and one report format) does not fit all. Just like different websites need slightly different SEO strategies, so too you need to tweak your reporting template to match the client’s needs.

Many people, particularly entrepreneurs with small, local businesses, have very little SEO knowledge, even of the basic terminology, and so you need to provide clear explanations of the concepts and metrics that appear in your reports to make them understandable. Even reporting to more knowledgeable clients requires thought – in most cases, bombarding them with lots of long, detailed tables will achieve the opposite of what you had hoped to. Instead of impressing them with your achievements, you may be dooming your reports to end up in the digital version of the infamous circular file.
In your initial meeting with a client, you should get a pretty clear picture of their knowledge of SEO concepts and terminology (you’ll also obtain an idea of what type of person they are and what’s important to them).
As you’re building your SEO report template, spend some time creating little informative snippets to position adjacent to your tables and graphs. It’s time well spent. These snippets can be part of a customized report template that you use for less knowledgeable clients.
Some Winning Report Formats
Now that we’ve laid out some general guidelines for SEO reports, let’s review some impressive formats you can use to convey data in an attractive, easy-to-understand way. One of my favorite reporting formats is the single metric widget.
Single Metric Widgets
The reason that single metric widgets are so powerful is that they highlight that one metric that you want to spotlight in a visually attractive way — simplicity and beauty blended together. See the example below presenting the average rank of Jaguar versus the competition. Take note that average rank can be misleading if you include all the keywords being tracked to figure the average because you’re almost certainly tracking more keywords than you have optimized, but if you set up the widget to include only a subset of the keywords that you are ranking, it can be a great comparative metric.
![]()
Besides the main metric, the trend graphs and comparisons to the previous period and the previous year provide valuable perspective on performance over time.
Graphs and Widgets
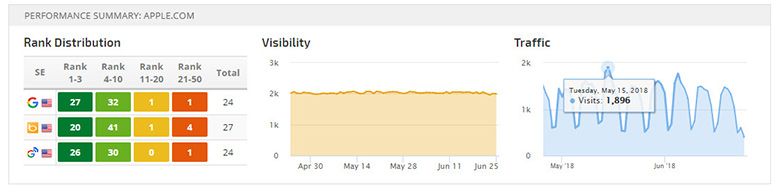
Graphs and widgets have some of the same magic as single metric widgets because they visualize and simplify. They make you look professional, and that never hurts. The following is an example of a blended widget showing a rank distribution table, a visibility graph, and a traffic graph showing sessions. With this one widget you are able to show the breakdown of rank on several search engines, overall trends for organic visibility, and a snapshot of traffic. That’s an awful lot of information condensed into a compact widget. Together with a brief explanation, this widget can provide customers with a good portion of the information they’re interested in.
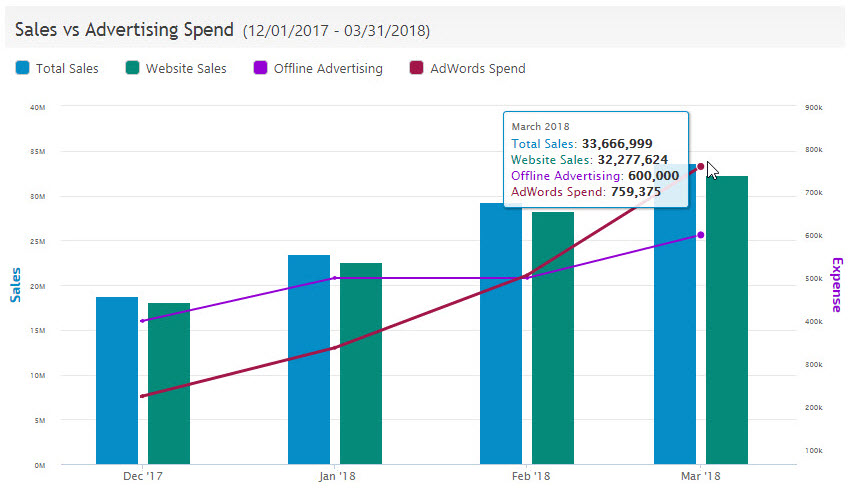
Being able to plot whatever metrics are important to your client is a big plus. To do that, you’ll need a reporting tool that allows you to plot data from a wide variety of sources. Once such tool is Rank Ranger’s Insight Graph. The Insight Graph below includes keyword rank data, revenue data from Google Analytics, ad spend from AdWords, and offline advertising costs pulled from a Google Sheet. One thing you need to pay attention to when creating custom graphs is to choose colors that go well together and a combination of chart formats (line, bar, area, etc.) which help the different metrics stand out.
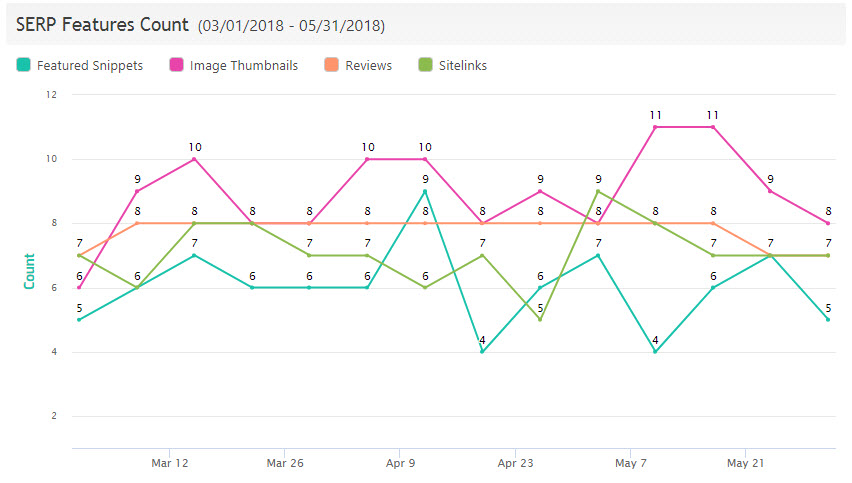
Below is another example of how a graph can present SEO results in a visually engaging fashion. This graph shows the number of Featured Snippets, image thumbnails, reviews, and
Reporting to Less Savvy Clients
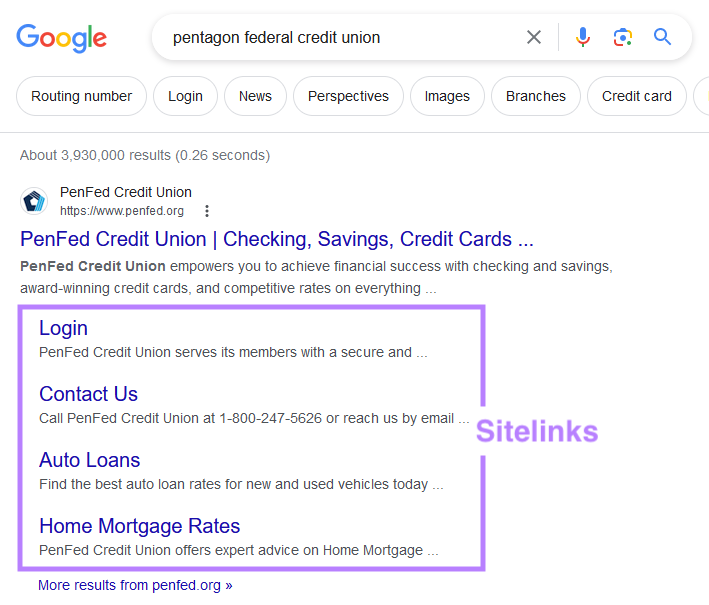
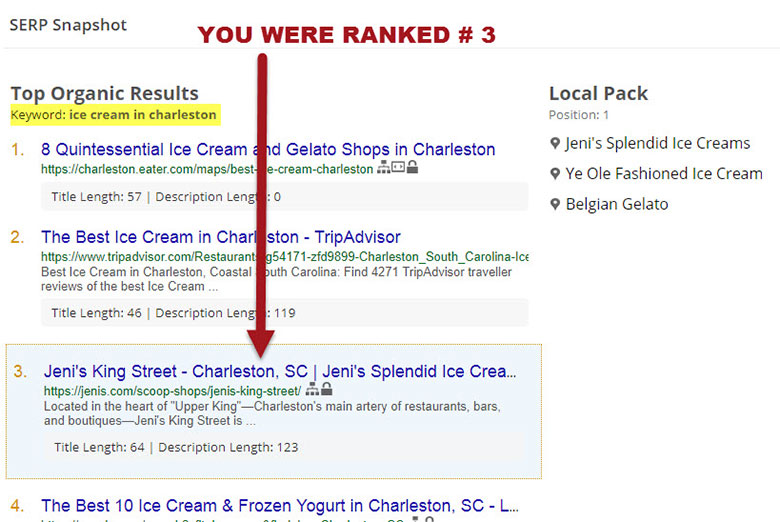
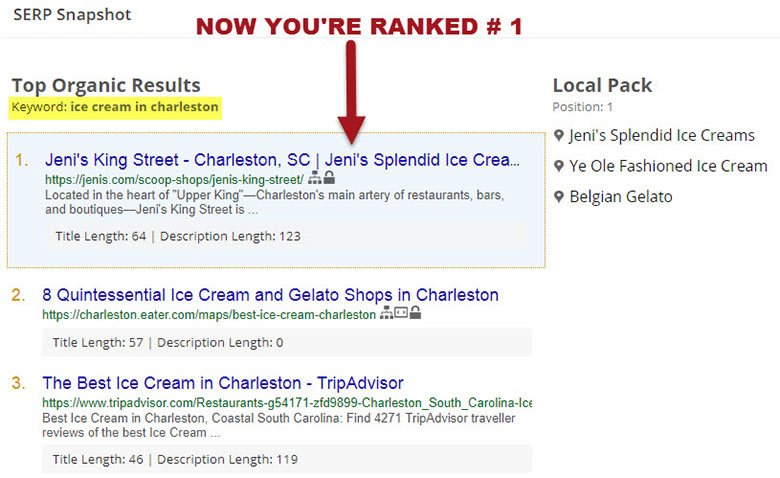
For your less SEO savvy clients, don’t shy away from using some visual aids to show value achieved. Even the most novice computer user knows what a SERP looks like (even though they don’t know what a “SERP” is), so you can include before and after SERP snapshots in your SEO report to visualize a significant rank change. See the example below.
Avoiding Pitfalls with Uninformed Clients
There are some professionals in the SEO industry who have come to the conclusion that for small, uninformed business clients it is counterproductive to show them rank at all. One such professional is Joy Hawkins, a well-known name in the local SEO field, who wrote that she spends tons of time analyzing rank reports but remarked, “How many times have you had a client call you freaking out because they noticed a drop in ranking for one keyword? I chose to help stop this trend by not including ranking reports in my monthly reporting and have never regretted that decision.”
I think Joy’s approach might be beneficial when working with small, unsophisticated clients. The staff time required to service the client could be prohibitive if providing details of rank in reports causes them to overreact to rank fluctuations.
What SEO Reports Should Include
Obviously, SEO reporting can vary greatly depending on the types of services you’re providing to a particular client. One thing is for sure though and that is that in addition to rank, reporting on traffic analytics and conversions
Below are some report options to choose from and some sample reports. We’ll start out with rank reporting because that’s kind of the meat and potatoes of SEO.
Rank Reports
Average Rank
Average rank is a metric which gives some indication of the overall success of SEO efforts and as such is an important indicator for clients. Its main value is derived from comparing average rank values to the past or versus competitors. When you blend average rank together with metrics like visibility and traffic, you can show how rank performance has translated into traffic.
![]()
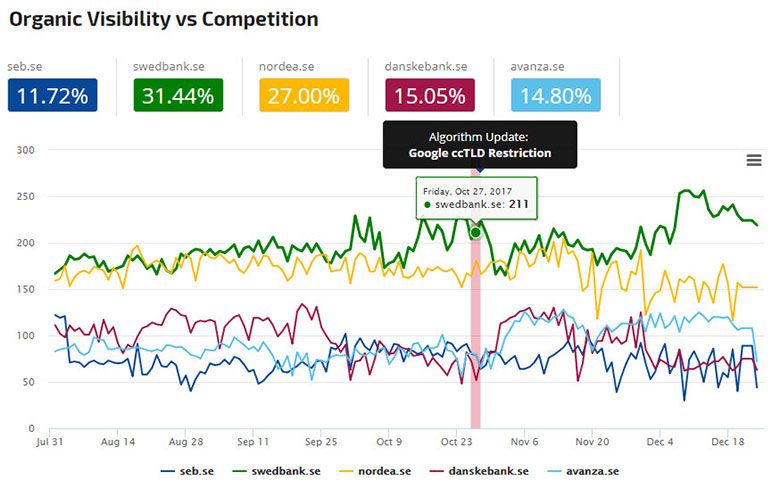
Organic Visibility Graph
An organic visibility score is similar to average rank in that it quantifies whether, on aggregate, a website’s organic profile is gaining or losing traction. The value added by the visibility score is that it is calculated by weighing the rank of each keyword appearing in the top 30 search results by the average search volume for that keyword. That means that the rank of keywords with greater search volume influences the visibility score more giving you and your client a much more accurate picture of how successful the SEO efforts are in getting more eyeballs to see your presence on the SERP.
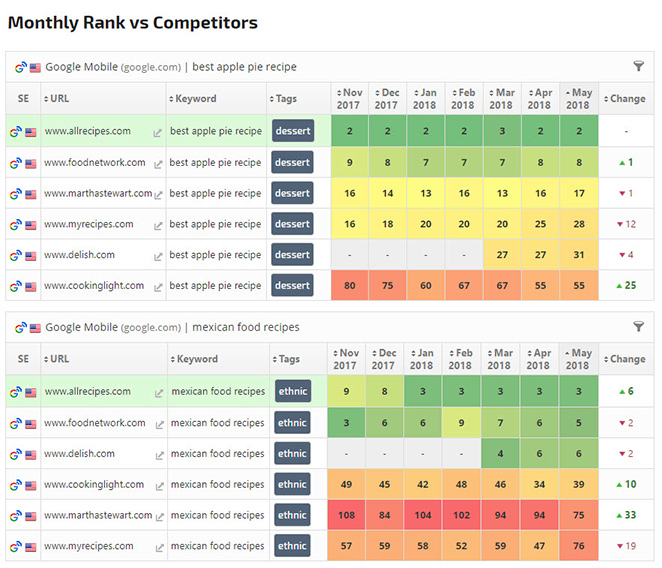
Monthly Rank Snapshot
To provide some detail on the rank of specific keywords, a snapshot report showing the average monthly rank is a great way to go because it focuses your client on the rank trends over big picture. Including daily or weekly rank data in your reports will expose your client to the almost inevitable, and sometimes wild, rank fluctuations. That can put clients (and as a result you) on an emotional rollercoaster ride paralleling the ups and downs dictated by Google’s algorithms.
Depending on the client, you may want to provide a list of the most important keywords and/or those being optimized. You could also include a report showing your client’s rank vs the competition for the top keywords (see examples below).
![]()
Website Rank Distribution Report
Although the monthly rank snapshot, average rank, and organic visibility provide valuable metrics as to SEO progress, a website rank distribution report, like the one seen below, gives a unique, top-level understanding of the website’s organic success versus the competition. The report shows the number of keywords ranking in the oh-so-important 1st, 2nd, and 3rd positions, as well as the 4-10 and 11-20 positions, and so on.
This summary level format allows the client to easily see the ranking performance on each search engine being tracked and allows for easy comparison across the board – from Google desktop and mobile to Google’s Local Finder or Google Maps, Bing, Yandex, Baidu, or whatever.
Another great way to present the website rank distribution data is to use a customized Insight Graph. Using a graph has several distinct advantages:
- It’s a great format to show the rank distribution trend over time
- It visualizes the data in an attractive way
- You can color code your and your competitors’ data for side by side comparison
![]()
Traffic Reports
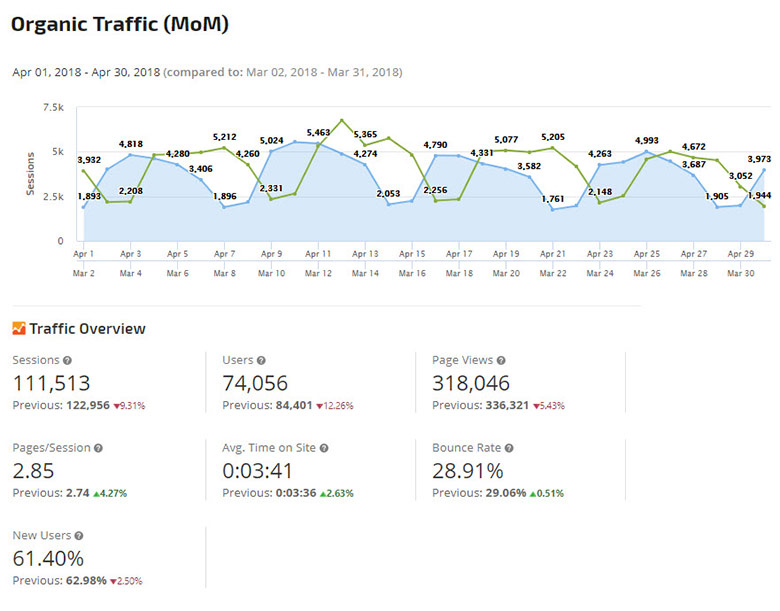
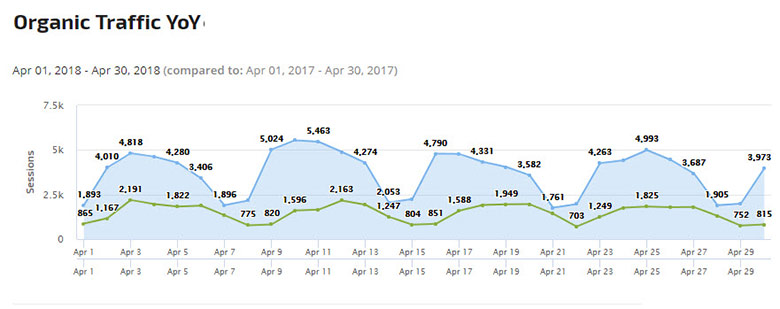
Traffic analytics are a very basic part of an SEO report. You’re not trying to push results to the top just to boast that you reached #1 on the SERP. You want to be able to show your clients the tangible benefits they’re getting from your services. Driving traffic is pretty darn tangible. Below is a prime example of why it’s important to review SEO reports before they go out. Sometimes the short-term results show negative vis a vis the previous month, but that might be due to seasonal trends or other factors. Meaning, you might consider adding a year over year report to show the same seasonal trend from last year and to point out the long-term upward trend.
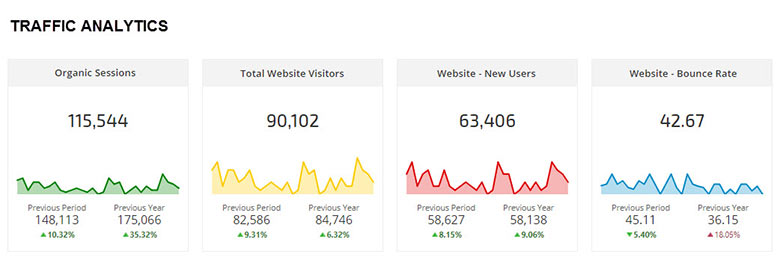
Another way to report on traffic analytics is to use single metric widgets like the ones below. Just one row of widgets tells the story of how website traffic progressed, and it keeps your report short and to the point.
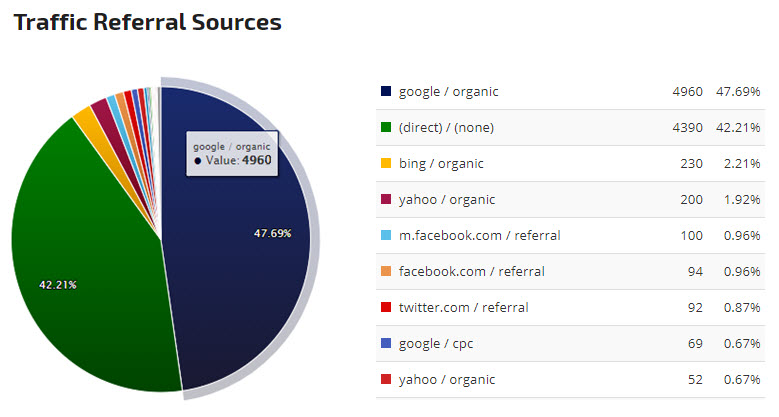
For more sophisticated clients, you can include a deeper breakdown of site traffic that includes data on traffic sources, demographics, geo-location, etc.
Conversions and Revenue Reports
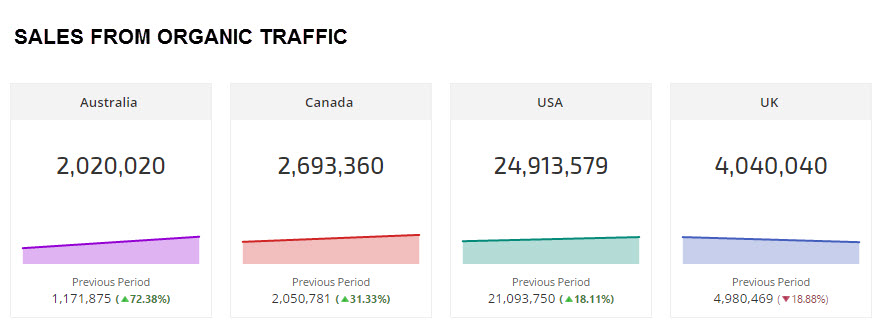
I emphasized this enough (actually if I really wanted to be a noodge, I could overemphasize it…), the most important reports are those that show revenue and return on investment for the money spent on your SEO services. You could use single metric widgets like the ones below to show online sales from organic traffic broken down by region.
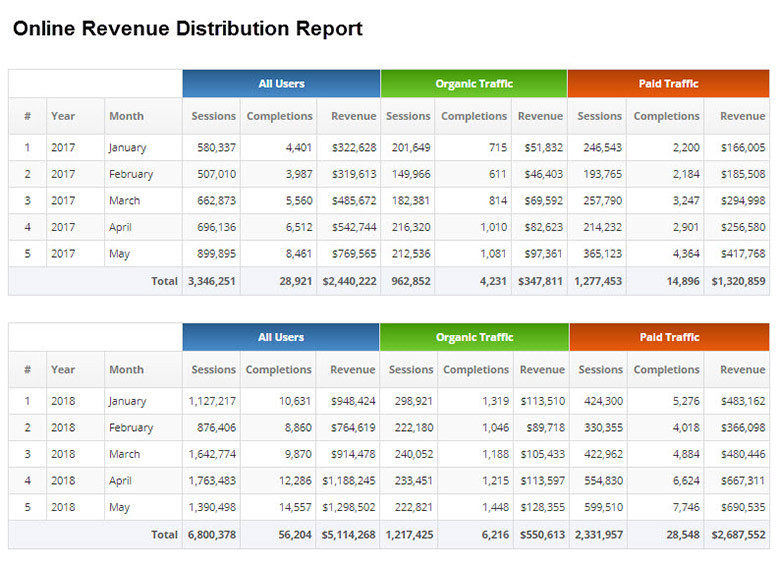
To provide a detailed report on online revenue over time, or any other type of goal completion for that matter, you can use a customized Marketing KPI report. Using any Google Analytics filter or custom segment you’ve set up, you can break down your revenue reports to compare organic-driven sales versus sales from overall, direct, and paid traffic. You can report on online sales by region, by device, by location, etc. You’re limited only by the segments you’ve set up in Google Analytics.
The following report compares sessions, completions, and revenue YoY for the months January to May for 2017 and 2018.
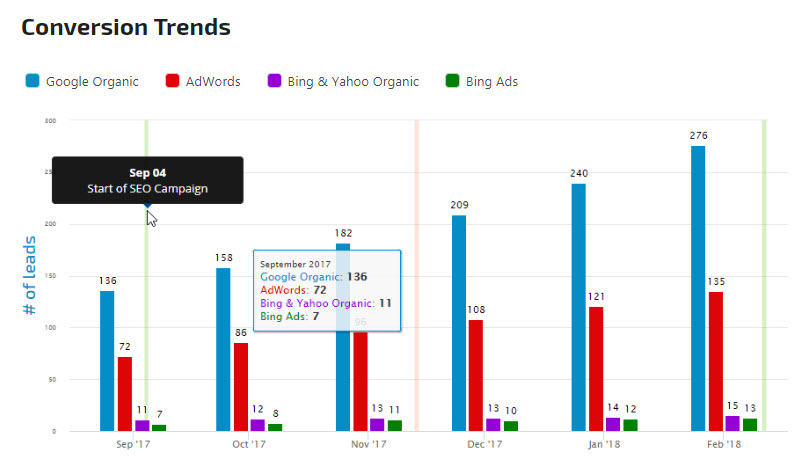
Another great way to show conversions over time is a trend graph like the one below which compares organic conversions on Google and Bing versus conversions from paid traffic.
Brand Visibility
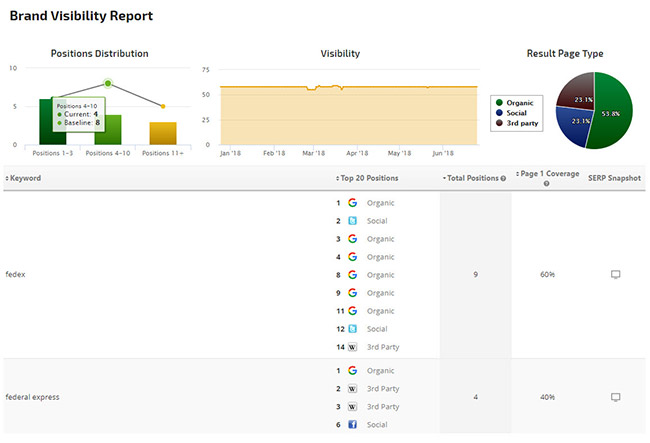
Including a brand visibility overview in your monthly report is a great service to provide. Particularly when your client is a large entity that wants to keep close tabs on their brand name. Sophisticated clients will probably request such a report. Your SEO team can use it to monitor the progress of their efforts to push up the client’s online assets such as their Facebook, Twitter, and Instagram accounts (and placement in the Local Pack for local businesses). The report shows the coverage of page one and page two search results by the brand’s website, the brand’s social media properties, and even positive third-party websites.
The detail of the top 20 positions is shown visually with an icon which makes it easy to identify the website’s organic results, local pack results, social media properties, etc. As with other reports, adding a brief note bringing attention to the actions taken and progress achieved goes a long way to point out value provided.
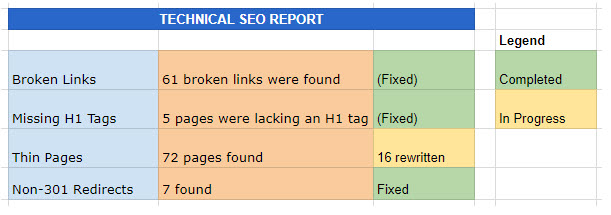
Technical Audit Summary
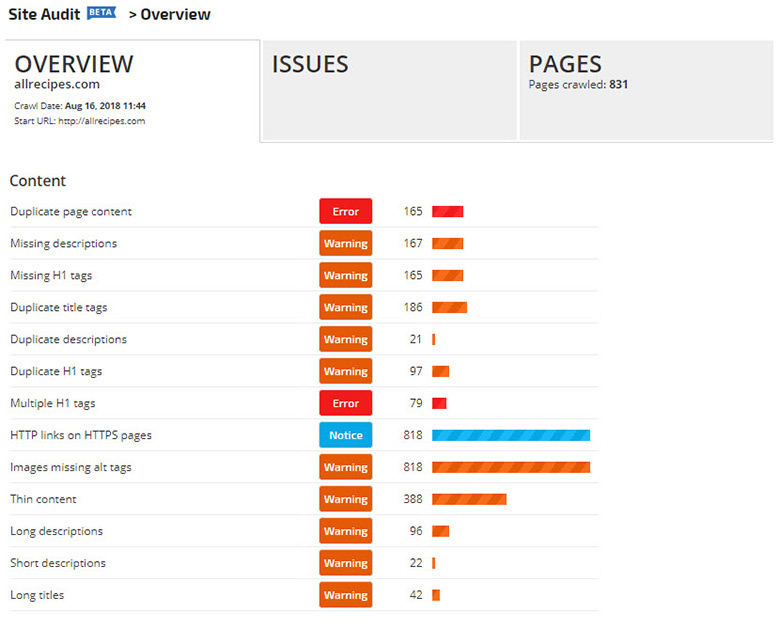
It’s a good idea to include a periodic technical audit summary which shows that you’re making sure the client’s website has a clean bill of health. It can range from a couple of sentences summarizing the technical situation of their site to showing trends using a graph or an overview table with the issues and their statuses.
Rank Ranger’s site audit tool provides you with a detailed report of the issues that need to be corrected on a website, but leave the nuts and bolts data for yourself and the summary level report for your customer (see below).
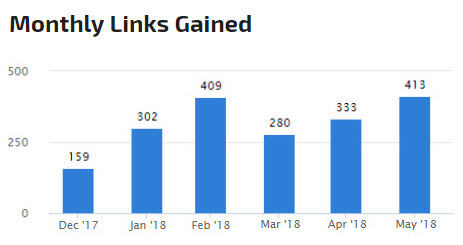
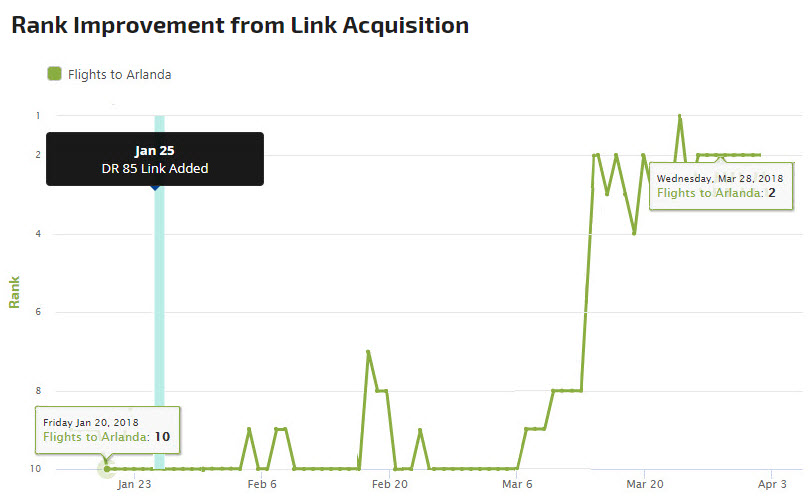
Backlink Overview
A lot of time and resources go into link building efforts (or at least it should), so for certain
PDFs vs Marketing Dashboards – Which Way to Go?
After you’ve decided what to include in your SEO reports, depending on your SEO software, you may have the option to send out your reports as PDFs or to use customized marketing dashboards for your clients.
What’s the best format to use?
Each of the two formats
That being said, the two mainstream reporting formats are PDF reports and online marketing dashboards. Let’s take a look at the advantages and disadvantages of each format.
Advantages of PDFs
- Minimal client effort required, just to open the PDF attachment
- Very conducive for printing (when the printer works!)
Disadvantages of PDFs
- File size can become an issue, particularly with long, graphic-heavy reports
- The email with the PDF may not arrive due to anti-spam filters
- Some companies block the downloading of email attachments
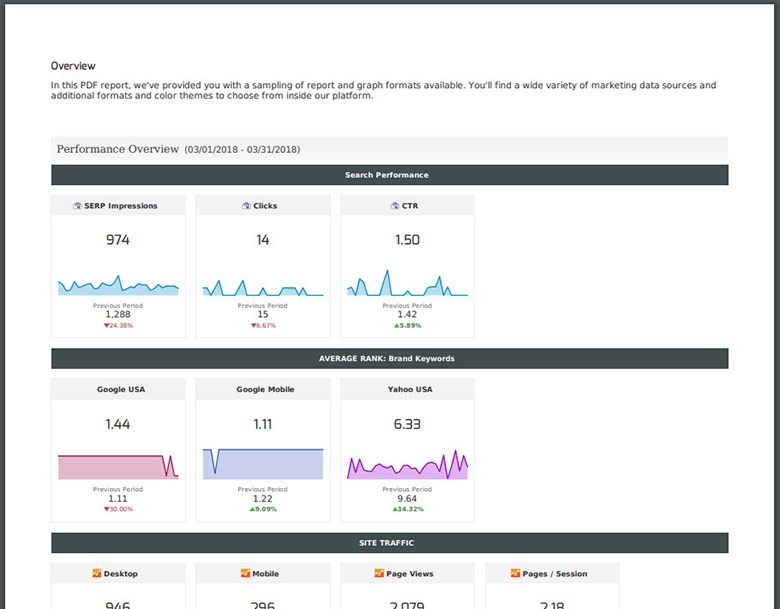
PDF Report
Advantages of Marketing Dashboards
- The report archive is readily available to
client - Reports can be responsive and interactive
- More design flexibility
- Tables and other reports aren’t cut off by inconvenient page breaks
- Allows for embedded reports and multimedia
- Tables can show the most important results but can also be expanded
Disadvantages of Dashboards
- Clients need to be reminded to review the reports
- Clients may experience some latency in data load times from 3rd party data sources
- Some less technically savvy clients may not feel comfortable using a dashboard
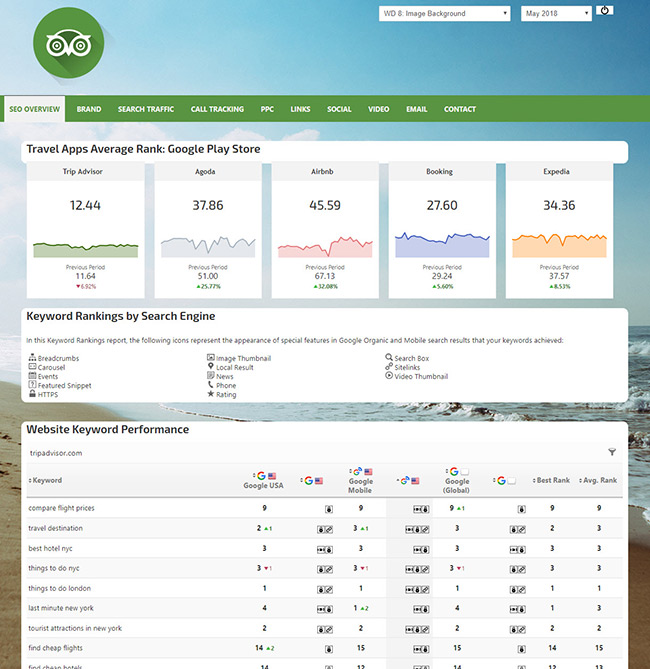
Marketing Dashboard
The bottom line is that there is no one winning format, and it’s best to have access to both so that you can provide customers with the format that works best for them.
And Finally – Is Sending Out a Report Enough?
After preparing your killer SEO report which you have honed and perfected, you pressed the send button (or better yet, it’s sent out automatically) and off it goes to your client. Whew, what a relief!
But wait a second, are you really done? How do you know your client opened your email? Maybe they didn’t even see it because it ended up in the ominous spam folder or disappeared into their overloaded inbox! Moreover, even if they did open your report, maybe they took a quick glance and didn’t get any value out it. For these reasons, it may be worth regularly reviewing SEO reports with clients in an online or face to face meeting (depending on the client).

I discussed this very topic with SEO expert Ari Nahmani, CEO at Kahena Digital Marketing, at a recent conference we both attended. Ari said that, based on his experience, reviewing SEO reports with clients is crucial: “It’s a way to ensure the customer sees the value they’re getting and allows the account manager to build a warm, personal relationship with the person overseeing our work.”
Summing it Up
Creating SEO reports is both an art and a science. It’s an art because you need to understand your clients and tailor your reports to their needs, their industry, and their level of knowledge. It’s an art because you need to design a report that looks professional and attractive. It’s also a science because there are general rules like focusing on top-level reporting, highlighting tangible results, and building templates for “types” of clients.
SEO reporting is an integral part of managing the client relationship and so it deserves strategic thought and planning to maximize results. So many resources are invested in acquiring clients. However, keeping them happy and retaining them is probably one of the most worthwhile (but neglected) areas to invest time in.
There’s no time like the present.
About The Author