

Google rolled out continuous scroll in the desktop search results in the U.S. on December 5, 2022, which follows a rollout in the mobile search results in October of 2021. It’s basically like infinite scroll for the search results. When you approach the bottom of page one, the second page of results seamlessly load, enabling users to easily continue their journey to find answers.
For site owners and SEOs, this means hidden treasures ranking on page two and beyond in the search results could see higher visibility (as users load additional pages in the SERPs without having to click the next button at the bottom of each page). I said “could” because that’s in theory and would need to be proven via data. It wasn’t long before I started hearing questions about how to best track the addition of continuous scroll in the desktop search results, and how that’s impact clicks, impressions, and click through rate. That’s when I fired up Analytics Edge in Excel to come up with a solution that could help.
Automating A Solution By Combining The GSC API And Analytics Edge In Excel
If you’ve been following me on Twitter and reading my blog for a while, then you have probably seen some of my tutorials for using Analytics Edge to automate the exporting of data from GSC (and then automatically work with that data via macros). Analytics Edge is an amazing solution created by Mike Sullivan and I often call it a Swiss Army Knife for working with various APIs.
In this tutorial, I’ll explain how to bulk export data from GSC, compare that data to a previous timeframe, filter by position in the search results, and create separate worksheets by Google search result page. When you’re done, you will have separate worksheets for page two, page three, etc., and you’ll be able to see the difference in clicks, impressions, and click through rate based on Google rolling out continuous scroll in the desktop search results in the United States.
Let’s jump into the tutorial. I’m sure you are eager to see the data for your own properties!
Tutorial: How to use Analytics Edge to analyze the impact of continuous scroll in the desktop search results.
1. Set up Analytics Edge in Excel:
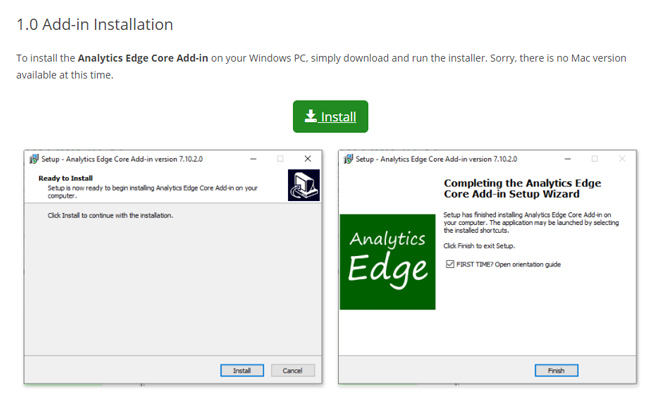
I have covered this several times in previous tutorials. Please reference those blog posts to learn how to download and install Analytics Edge. For example, my post about creating Delta Reports explains how to set up Analytics Edge. Also, there is a free trial available for Analytics Edge, and the cost is super economical (it’s just $99 for the year for the core add-in and $50 per year for the Google Search Console add-on). Note, Analytics Edge is up to version 10.9 now (the image below shows a previous version).
2. Export all GSC data for the timeframe AFTER Google rolled out continuous scroll in the desktop results:
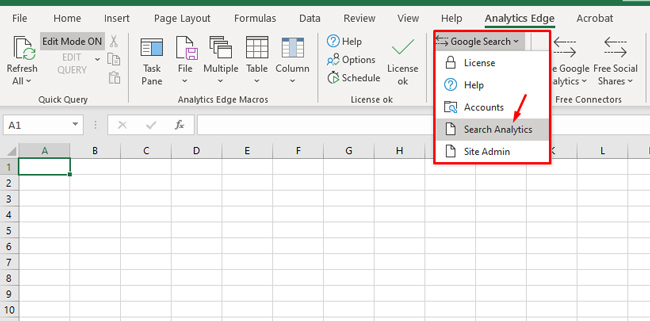
Analytics Edge enables you to build a macro with several tasks that work together to accomplish your goal. The first step in our Analytics Edge macro is to export all GSC query data for desktop searches for the timeframe after continuous scroll rolled out in the desktop search results in the U.S. Click the Analytics Edge tab in Excel and click “Google Search”, and then “Search Analytics”.
3. Choose your settings for exporting data via the GSC API:
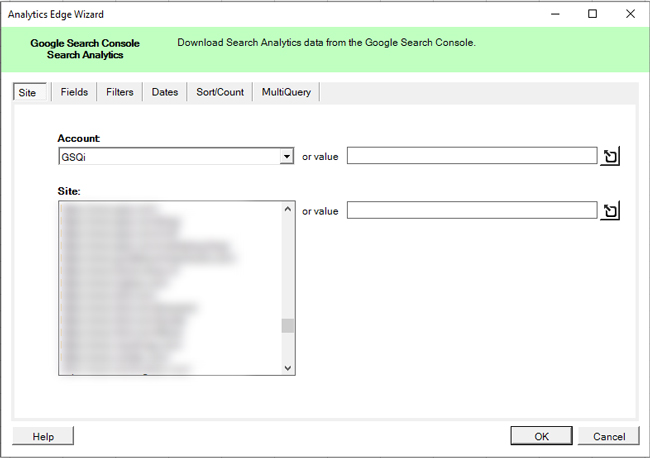
When the dialog box opens, select the account and then GSC property you want to export data from.
4. Choose dimensions and metrics to export:
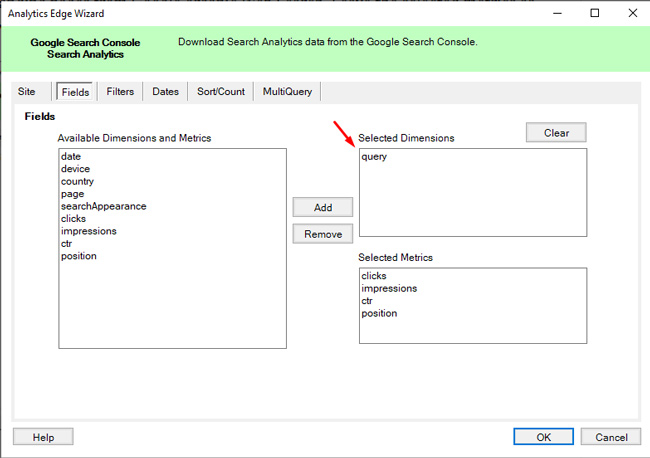
Then click the Fields tab and click the query dimension in the left side pane labeled “Available Dimensions and Metrics”. Then click the “Add” button to add that dimension to your export. Notice that the selected metrics include clicks, impressions, ctr, and position. Keep all of those as-is.
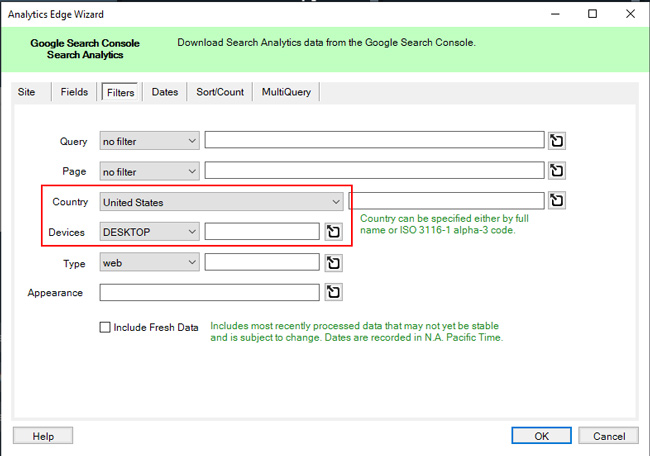
5. Set a filter for Desktop devices only in the United States:
Next, we don’t want to muddy our data with mobile traffic and non-U.S. traffic, since we are trying to analyze the impact of continuous scroll rolling out in the DESKTOP results in the U.S. only. So, click the “Filters” tab and click the dropdown for “Devices” and select “DESKTOP”. Then for “Country”, select “United States”. Then keep all other settings as-is for this tab.
6. Select dates to compare:
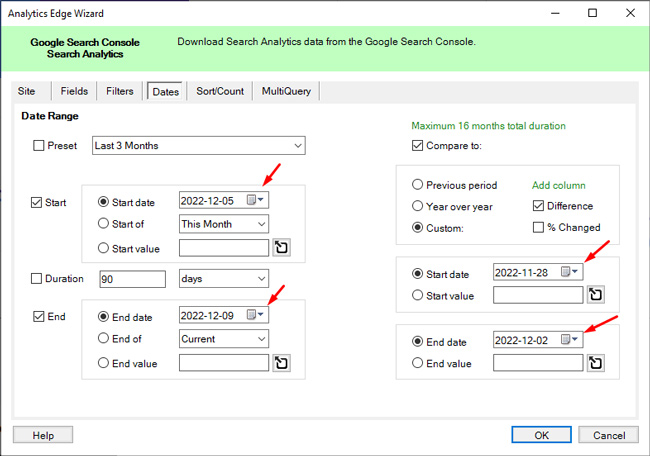
Next, we want to analyze the difference in clicks, impressions, and ctr for the timeframe after Google rolled out continuous scroll in the desktop search results to the timeframe before. The rollout began on 12/5, so select “Start” and choose a start **** of 12/5. For the end ****, I would choose a **** with full data (and not partial data). I used 12/9 as the end ****.
Make sure you select the “Compare to” checkbox and then enter dates to compare the data with. For the start ****, select specific dates that line up for day of the week and number of days. If this isn’t the same number of days, or if it’s a different set of days of the week, your data could be off. I selected 11/28 through 12/2.
7. Choose a sort order:
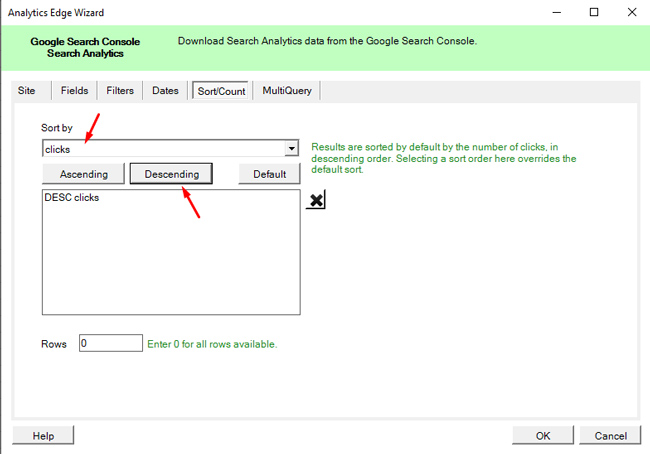
You can tell Analytics Edge to sort the results by a specific metric. For our purposes, you can choose clicks or impressions in descending order (which means it will be highest to lowest amount of clicks or impressions). Just select one metric for this tutorial (I chose clicks). Note, you can easily change the sorting once the data has been exported in Excel. Click OK to export the data.
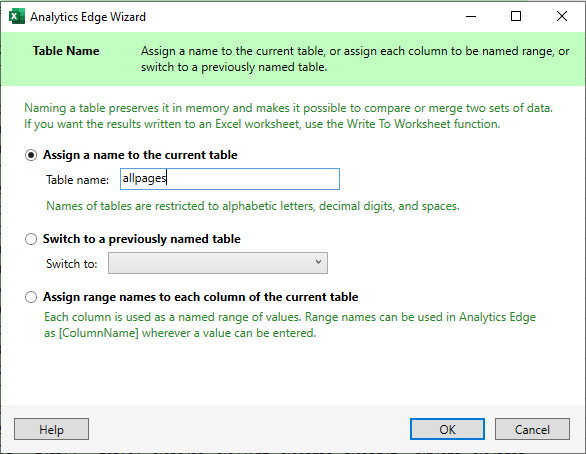
8. Set the table name:
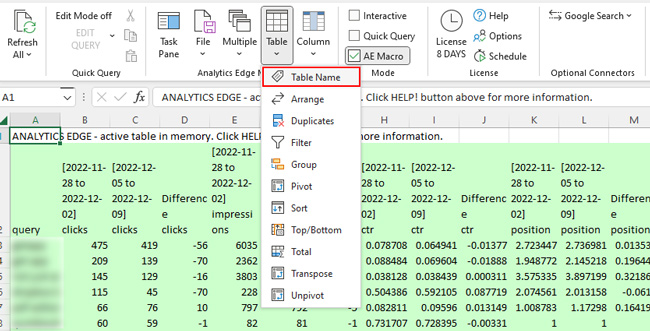
Analytics Edge will export the data and hold it memory. You will see a partial set of data in a worksheet highlighted in green. Before we write the full data to a worksheet, we want to store that data in a virtual table that we can reference later via Analytics Edge (so we can filter the data later on). To add the data to a table, click the “Analytics Edge” tab in Excel and then select “Table Name”. In the dialog box, set the table name to whatever you want. I named it “allpages”. Then click “OK”.
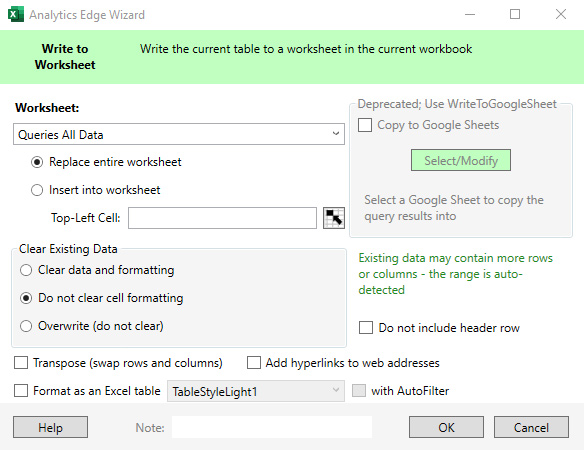
9. Write the full data to a worksheet (just to have all of the data documented):
Although we are looking to isolate queries where the site ranks on page two and three in the desktop search results, we are going to export all of your query data (just to have a worksheet you can reference if needed). You will notice Analytics Edge is showing you a subset of the data highlighted in green. The full data is in memory. To write that data to a worksheet, click the File menu in Analytics Edge and select “Write to Worksheet”. Name the worksheet something like “Queries All Data” and click “OK”.
10. Filter the data for just page two results:
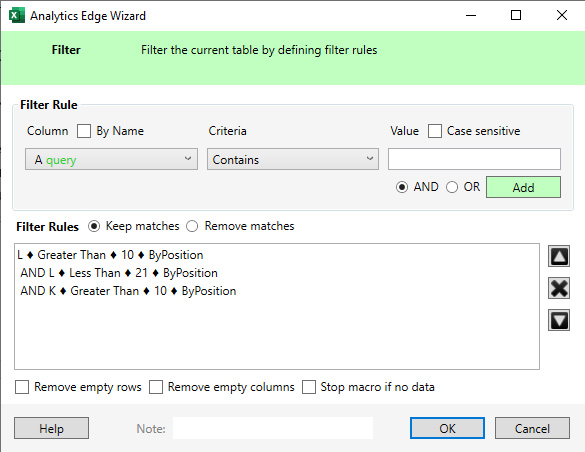
OK, so now we have a worksheet containing all of our query data compared to a previous timeframe. Next, we are going to filter the data to only pull results with a position of 11 through 20 (roughly page two results in Google) and write that to a new worksheet. Sure, some pages contain more than 10 results, but overall this should work for us. Click the “Analytics Edge” menu and click “Table”, then “Filter”. In the dialog box, we are going to filter by the column containing position for the time period after continuous scroll rolled out in the desktop results in the U.S.
Select the column in the dropdown box and choose “Greater than” in the criteria filed and enter 10. Then add another rule using the same field, but this time select “Less than” and enter 21. That gives us results with a position of 11-20. And to make sure we are comparing apples to apples, let’s make sure the site ranked in a similar position in the previous timeframe. So add one more filter rule using the field with the previous position and select “Greater than” 10. We are doing this to make sure the position didn’t radically change (and move from page one to two).
11. Write to worksheet:
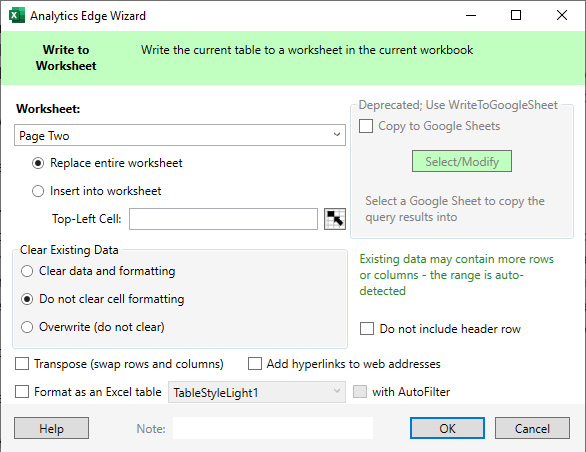
Now that we’ve filtered the results for just page two data, we need to write that data to a new worksheet (so we can analyze the data in Excel). Click the File menu in Analytics Edge and select “Write to Worksheet” like we did before. Name the worksheet something like “Page Two” and click OK. The new worksheet should appear with your data filtered for positions 11-20.
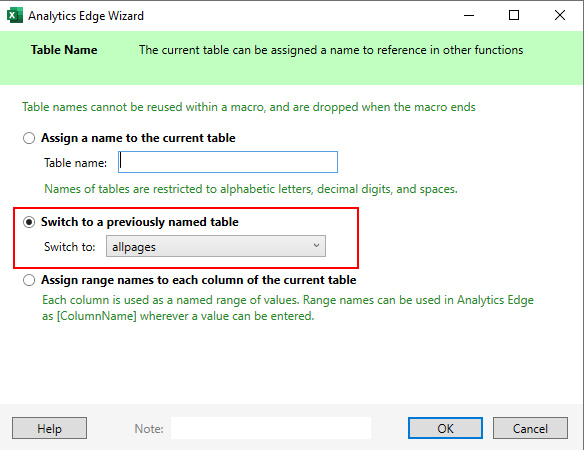
12. Set the table name again before filtering:
In step 10 we set a table name holding all of our exported data and I said we would need that again. Well, now that we exported the second page of results, we also want to isolate the third page of results. So, we’ll need to reference that virtual table again before filtering for positions 21-30. To do that, click the Table menu again and select “Table Name”. In the dialog box, select the radio button for “Switch to a previously named table” and select the “allpages” table we set earlier. If you named it something different, then choose that name. Then click OK.
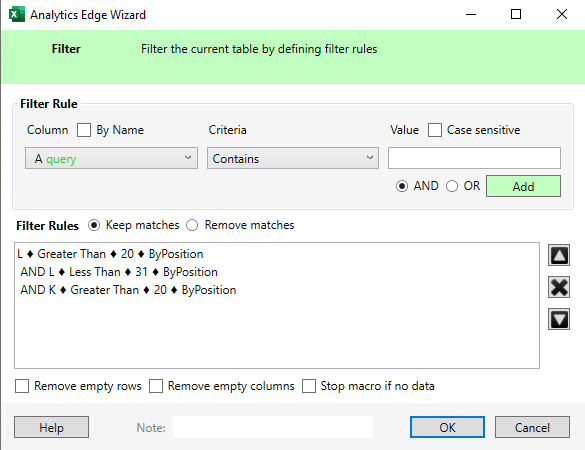
13. Filter the results for third page rankings:
Just like we filtered the results for page two rankings, we’ll do that now for page three. To do that, click the Table menu in Analytics Edge and then select “Filter”. In the dialog box, select the column for position for the most recent timeframe and select “Greater than” and set the value as 20. Then add a second rule and choose that column again, but this time select “Less than” as the criteria and enter 31. That will limit the queries to ranking between 20 and 30 (roughly page three in the Google search results). Then to make sure we are comparing apples to apples, add one more rule to make sure the previous position was at least 20. So select the column for position for the previous timeframe, select “Greater than” as the criteria, and enter 20. Then click OK.
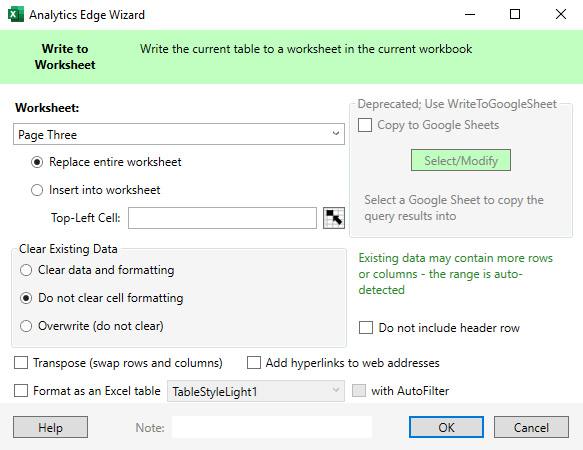
14. Write to worksheet to complete the macro:
Now that we are filtering by page three rankings, we need to finalize that step by writing the data to a new worksheet (so we can analyze the data separately). Click the File menu in Analytics Edge and select “Write to Worksheet”. Name the worksheet something like “Page Three” and click OK. The new worksheet will be created with page three data.
Congratulations! You just created a system for analyzing the change in impressions, clicks, and click-through rate based on continuous scroll launching in the desktop search results in the United States! Now it’s time to dig into the data to identify surges or drops across various metrics. Next, I’ll provide some final tips for working with the data so you can begin to identify the change based on continuous scroll rolling out on desktop.
Next steps and final tips for analyzing the data:
- I recommend formatting the CTR columns to percentages using Excel’s functionality. It will make it much easier to scan and determine the percentage change for each query. Also, once you run this for a specific property in GSC, the columns will retain their formatting. So if you rerun the query, the CTR columns should stay as percentages, which is great.
- I would also format the clicks and impressions columns to be “Number”, with no decimal points, and add a comma for thousands. Again, this is just to help you easily scan the data.
- And last, format the position columns to Number with one decimal place. So 11.9125 would become 11.9.
- Analysis-wise, look for larger changes in impressions and click through rate when scanning the data. That could mean that continuous scroll is having an impact for those queries. But, make sure position is comparable when checking the previous timeframe. For example, if you see a huge increase in impressions, make sure the position didn’t cause the change versus continuous scroll. If a site ranked on the bottom of page one versus top of page two, that could yield a big difference in impressions.
- I would also filter each worksheet so you can slice and dice the data. For example, you could easily sort the data by impressions in descending order (largest to smallest), you could do that by clicks, or CTR change. Playing with the data can help you surface interesting findings quicker. In order to filter, click the Data menu in Excel and click “Filter”, which is a funnel icon.
- You can also use color coding in Excel to highlight drops and surges in green and red. This is especially helpful if you are sending the data to a client or someone else in your company that isn’t as familiar with GSC data.
- And once you create a template, it can easily be used for other properties in GSC. Just save a new spreadsheet for each property you want to analyze. And again, the formatting for each column should remain (so you don’t have reformat the worksheet each time you export the data).
Summary – Determining the impact of continuous scroll on desktop via Analytics Edge and the GSC API.
With the addition of continuous scroll in the desktop search results in the U.S., users can easily make their way from page one to two (and beyond) without having to click to the next page of results. And that can definitely impact impressions, clicks, and CTR of your listing that are ranking beyond page one. Using the approach I explained in this tutorial, you can use GSC data to analyze the impact. If you have any questions while going through this tutorial, feel free to ping me on Twitter. I think you’ll dig using Analytics Edge for this task! It’s just another powerful way to use one of my favorite SEO tools.
GG