
Posted by
Mordy Oberstein
If you keep track of the news within the SEO industry, you’ll notice that Google constantly changes the data patterns of its SERP features. Throughout 2017 we reported on what must have been nearly a dozen major SERP feature increases or decreases. These near-constant SERP feature gains and losses piqued my curiosity and made me wonder, just how stable are some of the most important features on the SERP? Is the perception that many features undergo significant fluctuations accurate? Just how volatile are SERP features likes Featured Snippets, Knowledge Panels, Local Packs, and AMP?

A Little on the Method
Before proceeding, let me just walk you through the data I’m about to present. What I did was take a SERP feature and see what percentage of Page One SERPs the feature appeared on. I then looked at the next month’s data and recorded how many percentage points where gained or lost. For the sake of having a more complete picture, I looked at the 1st of one month in relation to the 1st of the next month, as well as the 15th of one month relative to the 15th of the month that followed (since I wrote this post before January 15th, the latter dataset has one less point of analysis).

Just for example, say that SERP feature “A” appeared on 45% of all Page One SERPs on January 1st, but only 40% on February 1st. This was recorded as a 5 percentage point loss. Now, the question is, which month does this data belong to, January or February? Since most of the data came during January, and because doing otherwise would be confusing, I called this data “January’s” data. The same goes when I looked at the data on the 15th of one month compared to the 15th of the next. In the case of January 15th’s data versus February 15th’s data, I simply refer to this as January’s mid-month data on the graphs below.
I did this for both 2016 and 2017 for Featured Snippets, Knowledge Panels, and Local Packs. In regards to AMP, only data from 2017 is included in this study (since AMP in organic results was only introduced once 2016 was well underway).
After collecting this data, I simply determined the average fluctuation and calculated the standard deviation. I used the standard deviation to determine if a feature was more or less stable and how the 2017 figures compared to 2016 (except in the case of AMP).
In a nutshell, there is a pretty decent amount of data that was analyzed. However, it is not an exhaustive set, and of course has its limitations.
==> Find out how to deal with SERP Volatility
Featured Snippet Volatility – Not What You’d Expect
So of course I’m going to start off with Featured Snippets. Besides for being seen as the Nirvana of SERP features, there was speculation that Google was limiting the feature. A lot of this caution came as there was a change in Feature Snippet data patterns back in November of 2017, just as more Knowledge Panels hit the SERP. But what does the data say? Are Featured Snippets volatile? Is your SERP strategy in jeopardy? Are zero-ranking wins harder than ever to come by? No, no, no, and no.
In fact, of all of the SERP features I analyzed, Featured Snippets were the most stable feature in 2016 and in 2017.
Featured Snippets Standard Deviation
| Year | 2016 | 2017 |
| Standard Deviation | 0.611 | 0.906 |
The results show this feature to be highly stable. In 2016, there were a few moments where the feature fluctuated somewhat substantially. When looking at October 1st relative to November 1st (considered October 1st data), the feature spiked 1.87 percentage points. However, this was offset by a series of months with almost no volatility. What is amazing to note is that Featured Snippets gained nearly 7.5 percentage points in 2016, it just did so very gradually.
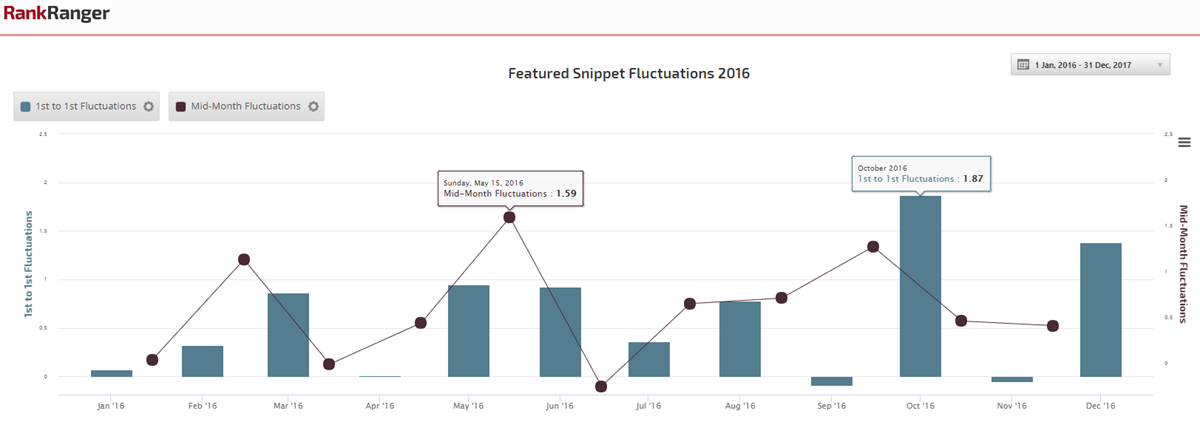
2016 Featured Snippet fluctuations comparing data from both the 1st and 15th of each month
2017 was slightly more volatile, but not by much. There were some significant changes with the biggest coming at the end of the year between December 1st and January 1st (2018) where the feature went from showing on 13.5% of all Page One SERPs (desktop) to 11.33%, a 2.17 point drop. What is important to consider is that 2016 was less volatile, despite the feature showing huge gains. Such was not the case in 2017. Meaning, fluctuations in 2016 have the added quality of being normalized (to a degree) as the feature was on an upward trajectory, whereas this was not the case in 2017.
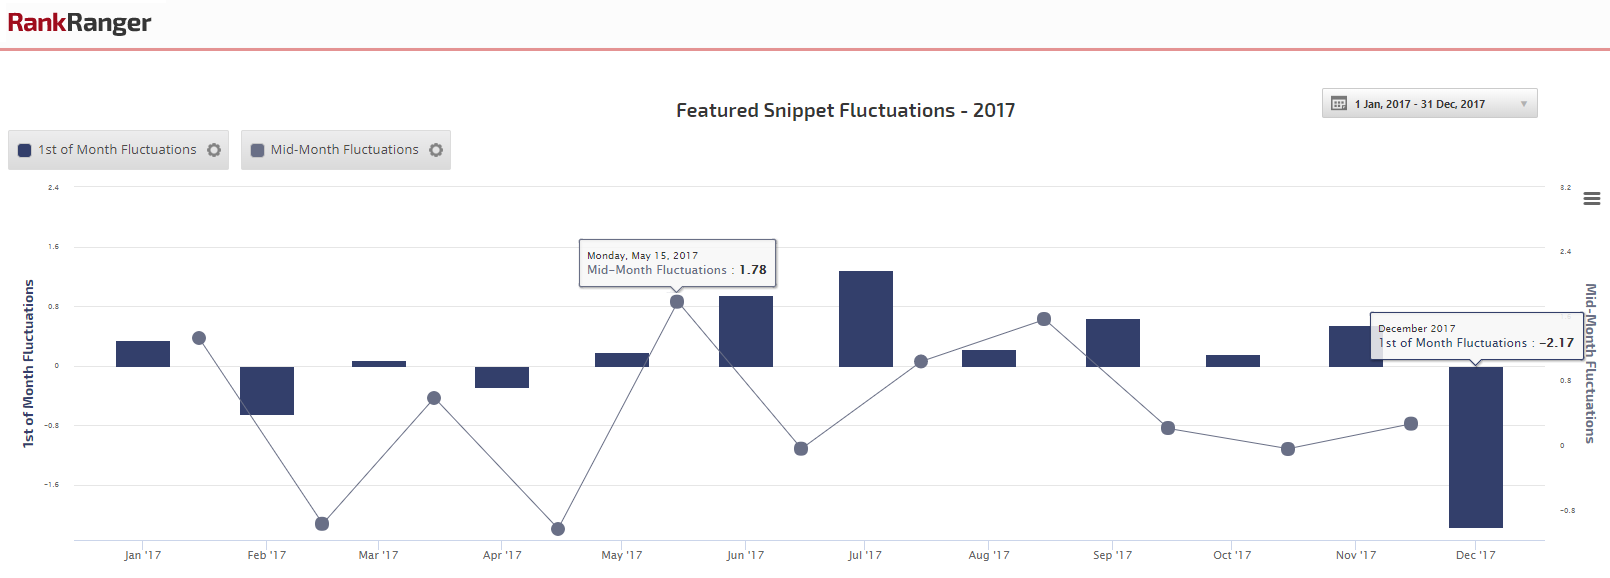
2017’s Featured Snippet fluctuations
Featured Snippets – What to Take Away
Despite the general perception that Featured Snippets are in a constant state of flux, the feature overall is quite stable, and has been for some time. This does not mean that Google isn’t swapping URLs for a keyword, or even changing which keywords result in or don’t result in a Featured Snippet. What it does mean is that Google is not shying away from using the SERP feature. As such, giving Featured Snippet scorings an integral role in your SEO strategy, is, in general, sound. The feature, though not showing outstanding gains in 2017, has had a consistent presence on the SERP.
==> Check out our guide to understanding SERP Feature Volatility
Knowledge Panel Moves Towards Increased Volatility in 2017
Traditionally speaking, Knowledge Panels are one of the least volatile SERP features out there. That’s not to say the feature has not undergone gains and losses, but less so than other features. Indeed, 2016’s standard deviation confirms this. Though, 2017 has seen a move away from this paradigm.
Knowledge Panel Standard Deviation:
| Year | 2016 | 2017 |
| Standard Deviation | 0.378 | 1.33 |
2016 was a highly stable year for the Knowledge Panel. Of all the data points I analyzed, not a single one showed a gain or loss that was more than a percentage point. The most significant fluctuation I tracked came when analyzing the August 1st data, where the feature saw a .97 point loss. The SERP feature started 2016 showing on roughly 10% of Page One SERPs and ended the year displaying on just over 9% of Page One SERPs. Pretty darn stable.
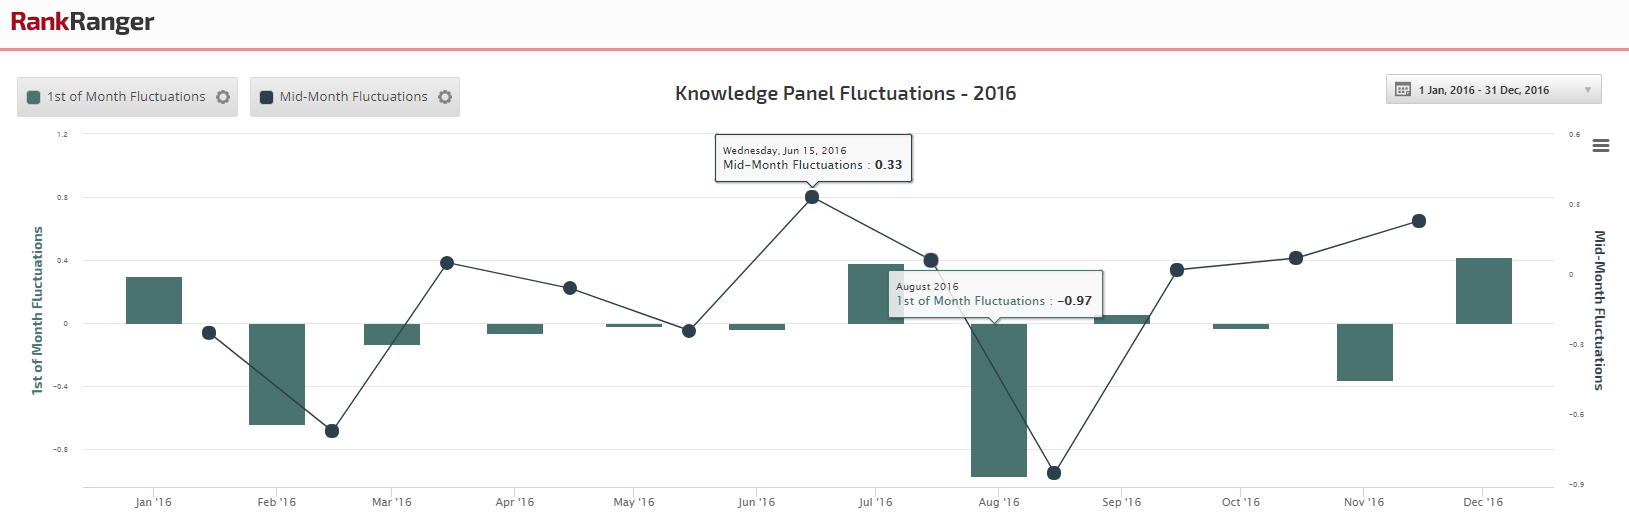
The most significant Knowledge Panel fluctuation in 2016 did not even break a full percentage point gain or loss
Not so in 2017. In fact, the year was a breakout year for the feature in some ways. The feature’s standard deviation jumped past a full point, which relative to 2016 is pretty substantial. Unlike 2016, there were six points where the SERP feature saw gains or losses that were greater than a percentage point.
So what happened? Well, the feature did not post big gains in 2017, so that’s not it. Knowledge Panel’s began 2017 on approximately 9% of SERPs and ended it at around the same levels. In fact, the first half of 2017 was without much volatility. However, and as you can see in the graph below, June saw a whole new data trend for the SERP feature that lasted through the end of the year. It’s these spikes and subsequent losses that saw the Knowledge Panel’s standard deviation for the year rise so dramatically.
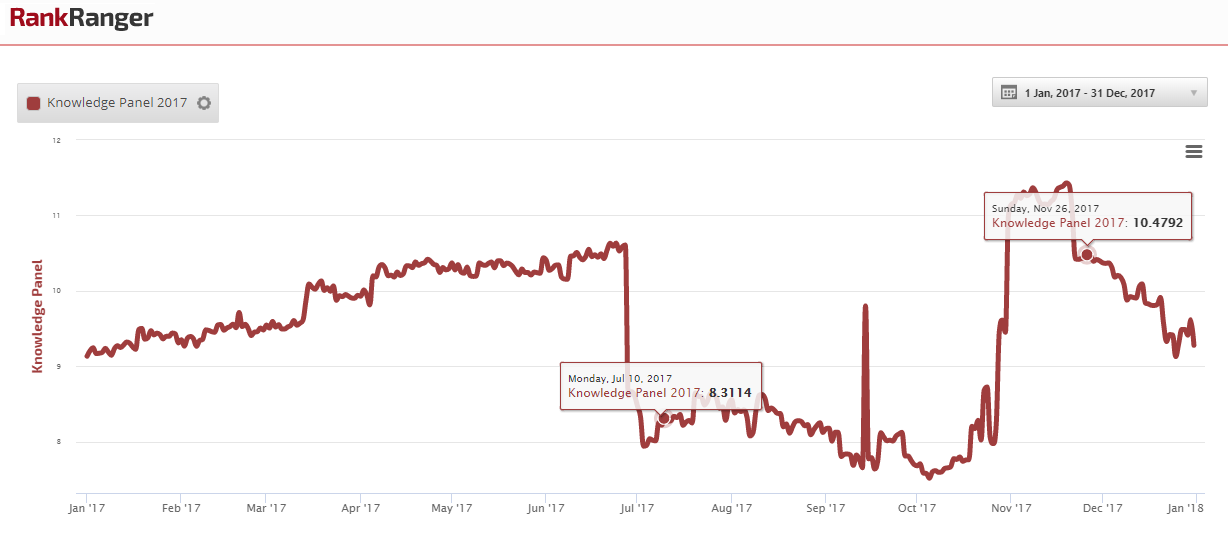
The percentage of Page One SERPs with a Knowledge Panel underwent a dramatic data shift that began in June of 2017
The Knowledge Panel fluctuations shown below clearly align to the pattern showcased above. The increase in fluctuations during the second half of the year is quite visible.
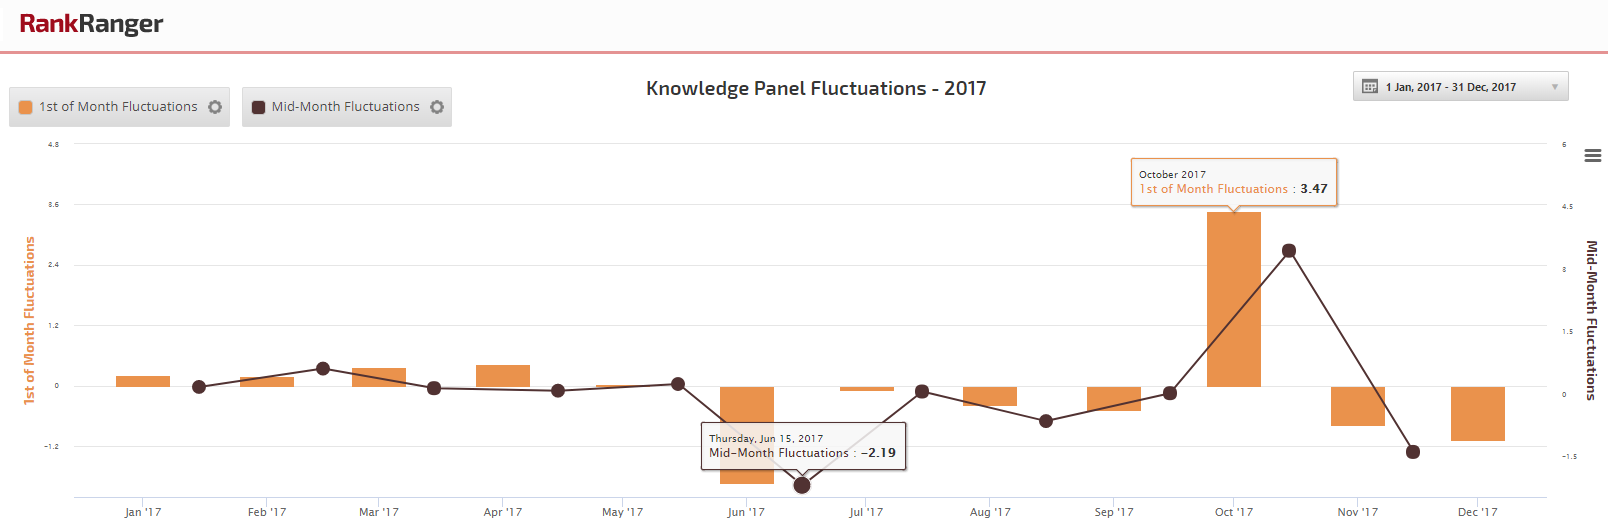
In 2017 the Knowledge Panel became significantly more volatile with the December 1st fluctuation metric showing a 3.47 point increase
Knowledge Panels – What to Take Away
Google has long had a fancy for tinkering with the Knowledge Panel. While I don’t have an exact number, it would not be a stretch to say that a significant proportion of all SERP feature tests and upgrades involve the Knowledge Panel. It seems that Google is finally seeing how the panel can actually be leveraged on the SERP. This is exemplified by a late November spike that saw Google running Knowledge Panels for very straightforward entities (i.e., furniture, socks, etc.).
If your sites relate to an entity, you will certainly want to keep an eye on your site traffic. With Google showing more Knowledge Panels for topical queries (i.e., quantum physics, psychoanalysis, existentialism, etc.) information-based sites focused on subject matter may now have some stiff competition via the Knowledge Panel.
With Google starting to actually play around with the display levels of the Knowledge Panel, keeping tabs on the SERP feature’s trends becomes important depending on the type of sites you’re working on.
Local Pack Instability
Local Packs are unique in that the connection between the SERP feature and actual dollars is relatively direct and intrinsic. An appearance in the Local Pack can mean more visibility and subsequently more business for a local establishment or service company. Local Packs, interestingly, were not one of the SERP features that I associated with volatility. Yes, there have been sharp increases and losses here and there, but my general association is not one of volatility. However, the standard deviation numbers tell a different story.
Local Pack Standard Deviation:
| Year | 2016 | 2017 |
| Standard Deviation | 1.25 | 2.07 |
Off the bat, and compared to both Knowledge Panels and certainly Featured Snippets, the general trend for the Local Pack is far more volatile. It is the only SERP feature I studied that had a standard deviation of over a full point for both 2016 and 2017. More so, the standard deviation almost doubled from 2016 to 2017. This is not one of the more stable SERP features, odd as that may sound.
Though early 2016 was more stable than other periods for the Local Pack, larger fluctuations are consistently at play. That is, as opposed to other SERP features, seeing the Local Pack fluctuate greatly is not uncommon. I would go so far as to call it the norm. That is, 2016’s relatively high standard deviation didn’t come from one or two unusually high data shifts that impacted the overall number.
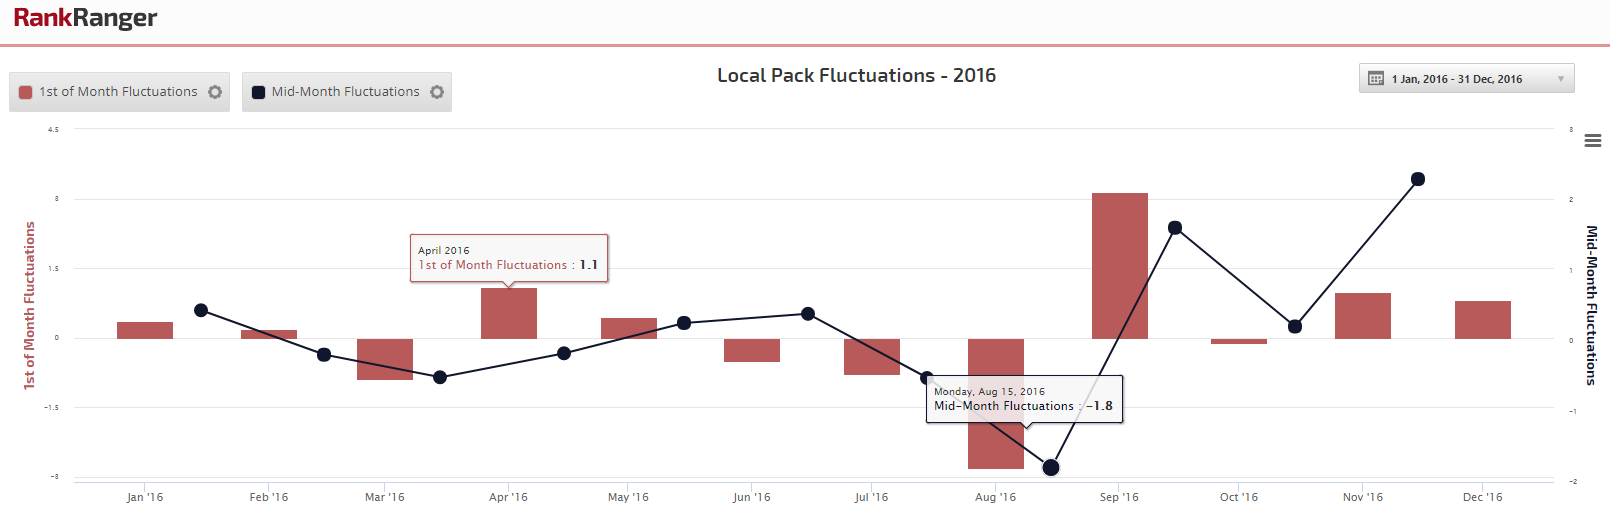
2016 Local Pack volatility as measured and compared from both the 1st and 15th of each month
The same is true for 2017, but to a much greater extent as the standard deviation doubled. What’s interesting in 2017 is that Local Packs went from showing on 32% of SERPs (desktop) to just over 45%, which is a nice increase. However, getting into the stability of the feature, the standard deviation did not increase dramatically because the feature is now populated on more pages. Neither does the data show a few sharp increases that skewed the averages sort to speak.
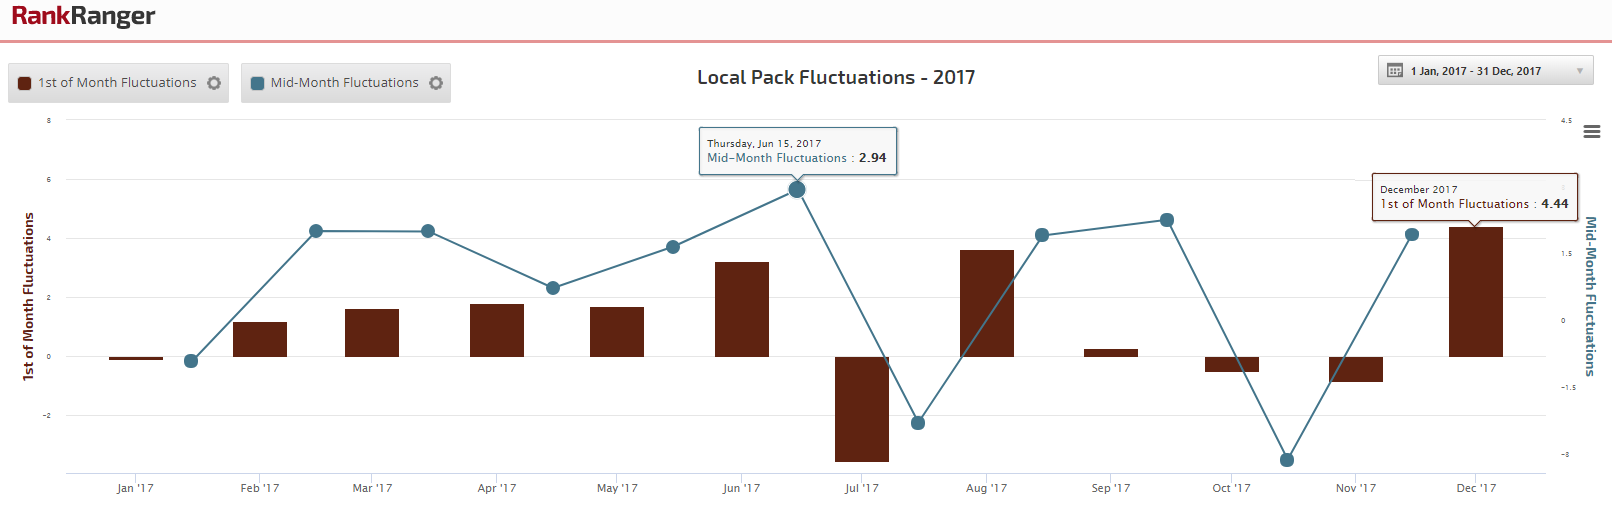
Local Pack’s 2017 fluctuations resulted in a standard deviation above 2
Rather, 2017 was dominated by large ups and downs. A whopping 16 of the data points that I analyzed had fluctuations above an entire percentage point. Of those 16, nine were over two points. Meaning, this feature fluctuates heavily and often. It’s just its pattern, and it appears as time goes on this volatility only gets worse.
Local Packs – What to Take Away
Here’s what’s interesting. You would think that Local Packs would be pretty stable. It doesn’t seem complicated. If the query relates to a local service of some sort, Google should show the Local Pack. Is Google really showing a Local Pack for NYC pizza places one day and not the next? It’s highly unlikely that keywords of this nature would not be consistent in their triggering of a Local Pack (which is not to say the sites within these Local Packs don’t fluctuate, that’s a different dataset altogether).
So let’s think beyond highly stable keywords that we all know pull up Local Packs. The fluctuations are not a result of Google pulling Local Packs for keywords like mechanic LA or accountants in Dallas. That being said, I’ve seen more and more of what I’ll call “service products” pulling Local Packs. For example, in 2016 lawn care equipment, carpet cleaning equipment, ge appliances, dishwasher parts, or microwave parts didn’t result in Local Pack appearances. In late 2017, these keywords all drew the SERP feature.
My point is that Google is expanding what it considers to be Local Pack worthy. At the same time, the feature does undergo decreases, with Google reigning in what it considers to be fit for Local Pack consumption. Anyone tracking local SEO campaigns needs to be diligent about tracking their Local Pack appearances and should not think that just because they’ve been in a Local Pack since the dawn of time or that Google has been showing a Local Pack for the keyword since the Big Bang, that this has to be so. Local Packs are highly volatile as Google has a lot on its plate when it comes to local listing quality (i.e., spam in the Local Pack). As the local algorithm updates of the more recent past indicate, the search engine is not afraid to shake things up considerably.
Gauging AMP’s SERP Volatility
How could I not include AMP among all of this desktop data? The issue with “organic AMP” is that we only began tracking it in the middle of 2016, when it hit the organic results. What I did instead of analyzing 2017’s volatility/stability against 2016’s (which I simply can’t do) was to showcase AMP’s behavior within the organic results as compared to within the news carousel.
At first glance, and by looking at the standard deviation, it would seem that AMP is a bit volatile.
AMP Standard Deviation
| Type | Organic AMP – 2017 | AMP in News Results – 2017 |
| Standard Deviation | 1.75 | 17.044 |
Let’s leave the incredible AMP in News Results stat aside for a moment and begin with AMP within the organic results. It would appear that AMP, despite Google’s push for it, suffers from some volatility. There were two sharp data shifts that impacted organic AMP’s overall numbers in 2017. In April there was a sharp decrease in organic AMP, as reflected by the 3.58 percentage points lost on the graph below (as measured from April 1st relative to May 1st). Then there was a sharp uptick in September, as can be seen on the graph below as well. Without those large shifts, the standard deviation here stands at .55, which is pretty stable. Now, if in 2018 we see another set of large shifts, then it could mean that this is the norm for the feature, and indeed organic AMP is a bit more unstable than thought. The jury is still out.
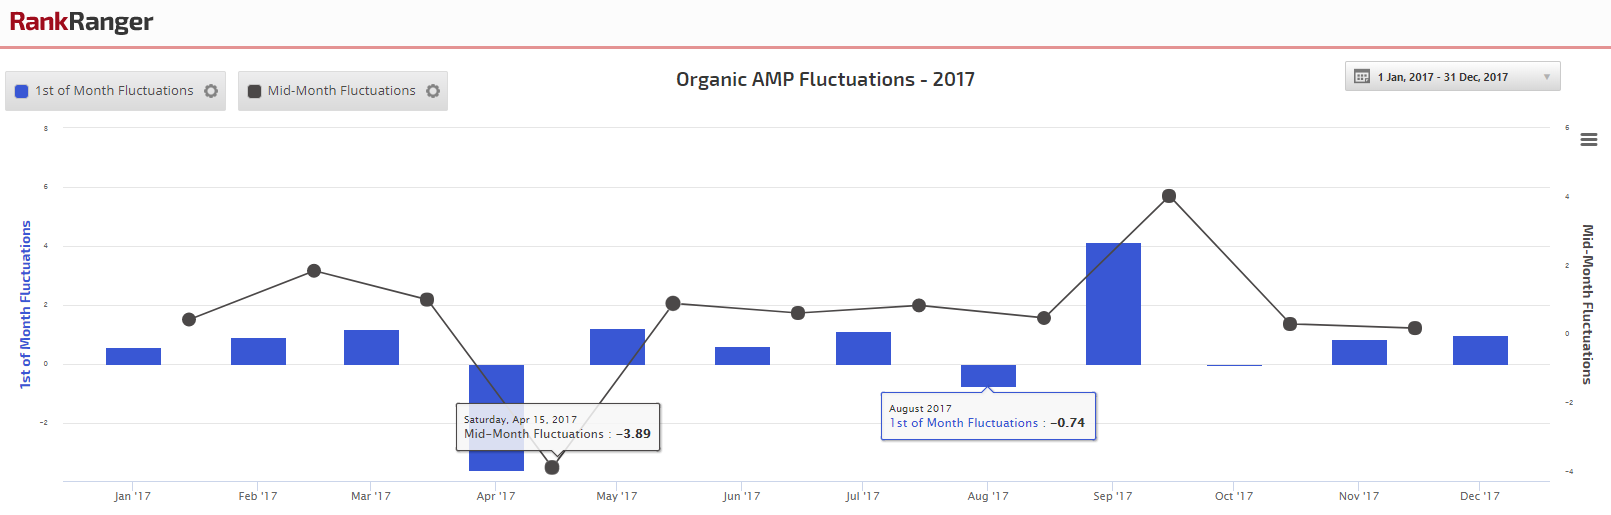
AMP in organic results showed some volatility in 2017, but was largely attributed to two large shifts
AMP in the news carousel is an entirely different story. It’s quite volatile, and there’s no way around that conclusion. To be fair, there was a one-time increase in January 2017 that made AMP the dominant force within the mobile News Box (see below).
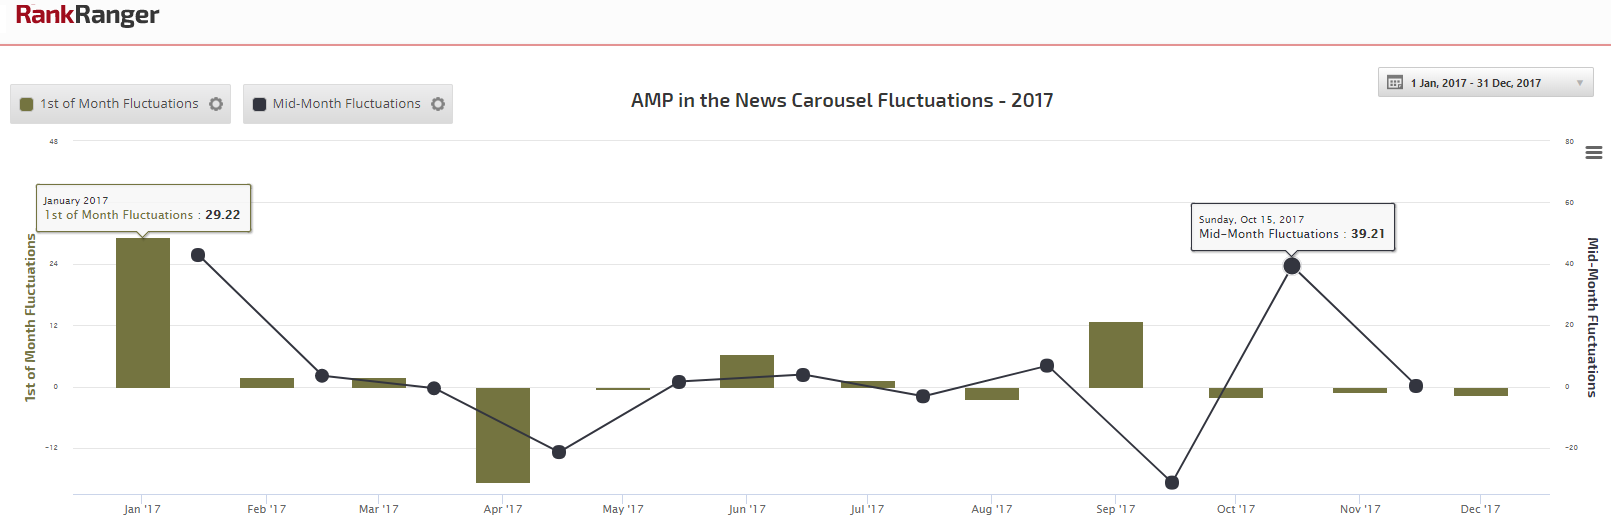
AMP in the News Box was highly volatile in 2017 with multiple large fluctuations
However, leaving the data for January aside (both the 1st of the month and mid-month comparisons) and the standard deviation would still be over 13. Looking at the mid-month data and there was a 21.57 point loss in April and a 6.66 percentage point gain in August. On top of that there was a whopping 31.54 loss in September that was followed by a 39.21 point restoration the following month. That’s too many to ignore. It’s more than a pattern, these fluctuations are the norm when it comes to AMP in the News Box.
AMP – What to Take Away
Publishers need to understand that while AMP is the dominant force within the mobile news carousel, it doesn’t mean that it is an entirely consistent force. That is, while publishers should clearly create AMP pages, they should also track those pages quite closely. Publishers that simply expect their AMP pages to rank well in the News Box consistently, could be in for a shock of sorts as Google does pull back when it comes to AMP in the news carousel (at times). That is, a bit of fluctuation vis a vis their AMP pages could be part of the normal course of doing business within Google’s mobile News Box.
A Picture of SERP Feature Stability
It’s easy to see SERP features as being stable until that news story breaks showing a sudden increase or a global roll-out, etc. However, as shown in the case of Local Packs, Knowledge Panels, and AMP within news results, that’s not always the case. In between the big news stories are fluctuations that can define the normal behavior of the feature. This makes securing a long lasting SERP feature win harder, depending on the context of course. It also means that the rank or traffic implications of a SERP feature are not just subject to your rankings, but Google’s intrinsic SERP feature behavior. Local Packs, and the impact of losing or gaining one, is the clearest example of where Google’s SERP feature seesawing can have a real impact, and one where you have little to no control. It just underscores how vulnerable things are these days. Though, and to be fair, when it comes to Featured Snippets or organic AMP, there seems to be more institutional stability than may have been expected, particularly as far as Featured Snippets are concerned.
Do you have a SERP feature that you’d like me to track? Wondering what the volatility trends for Reviews or Structured Snippets are? Let me know, perhaps I can run a second round of data on some other features.
About The Author