If you’ve been freaking out about Google’s newest ranking factor (let’s face it, who in SEO hasn’t?), then worry no more.
In this post, I’m going to show you exactly how to pass Google Core Web Vitals.
This is a complete guide containing everything you ever need to know to measure and optimize Google’s latest page experience factors.
I’m covering:
- What are Core Web Vitals?
- Why Core Web Vitals are important
- How Core Web Vitals are measured
- The three components of Core Web Vitals
- Five practical tips to ace Core Web Vital metrics
- And much more
Free Download: Page experience checkist containing 7-action steps you need to take to pass core web vtals. Includes 2 unique strategies not contained in this post
What are Core Web Vitals?
Core Web Vitals are a set of page experience factors that Google considers important in a webpage’s overall user experience. Core Web Vitals use “real-world” data to measure how users experience the speed, responsiveness, and visual stability of a webpage.
Simply put, Core Web Vitals are a subset of factors that make up Google’s “page experience” score.
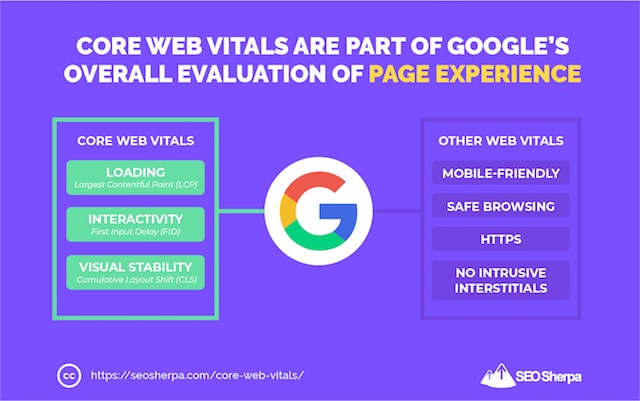
(Page experience is how Google assesses your page’s overall UX).
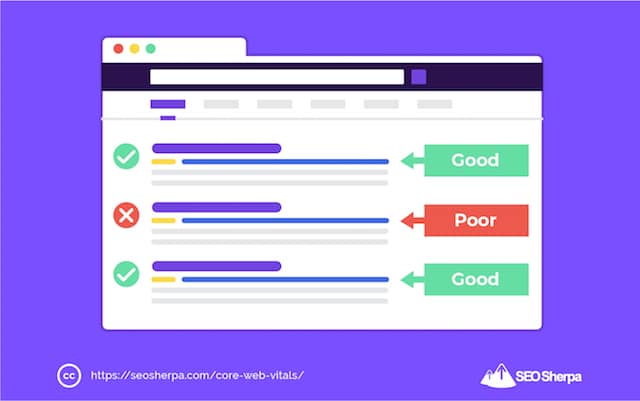
Unlike some other ranking factors, Google makes its measurement criteria for Core Web Vitals clear. Score “good” and you pass, score “poor” (or “needs improvement”) and your webpage is a Core Web Vital failure.
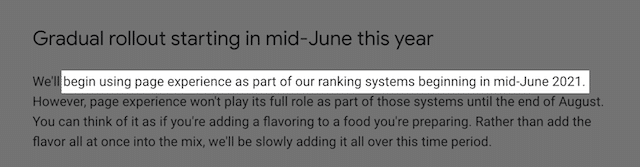
From June 2021, any web page not passing Core Web Vitals may lose its ranking, and be replaced by a page with a good page experience score.
So how do you know if your pages pass or not?
The easiest way to see how your site performs for Core Web Vitals is to view the Core Web Vitals report in Google Search Console. It’s located in the experience section of your Google Search Console account.
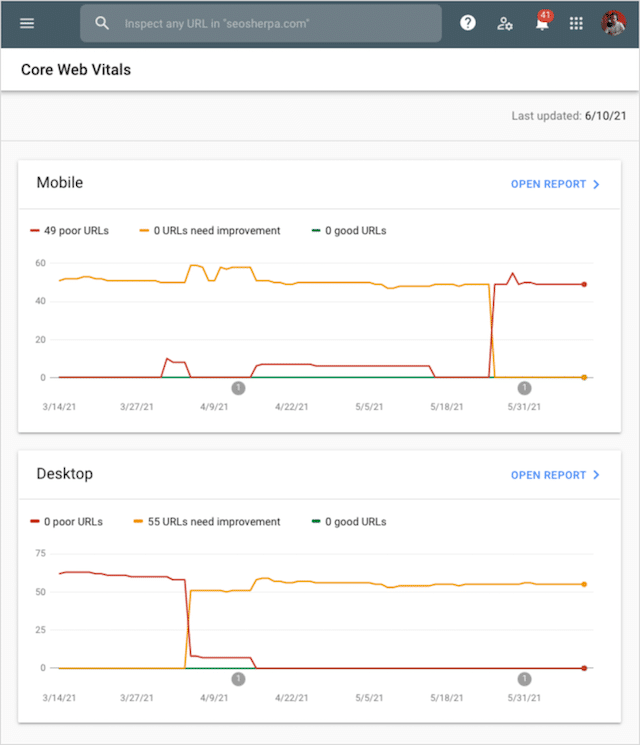
The GSC Core Web Vitals report will show you the number of URLs you have on your site categorized as poor, needs improvement, or good.
The report is broken down by desktop and mobile.
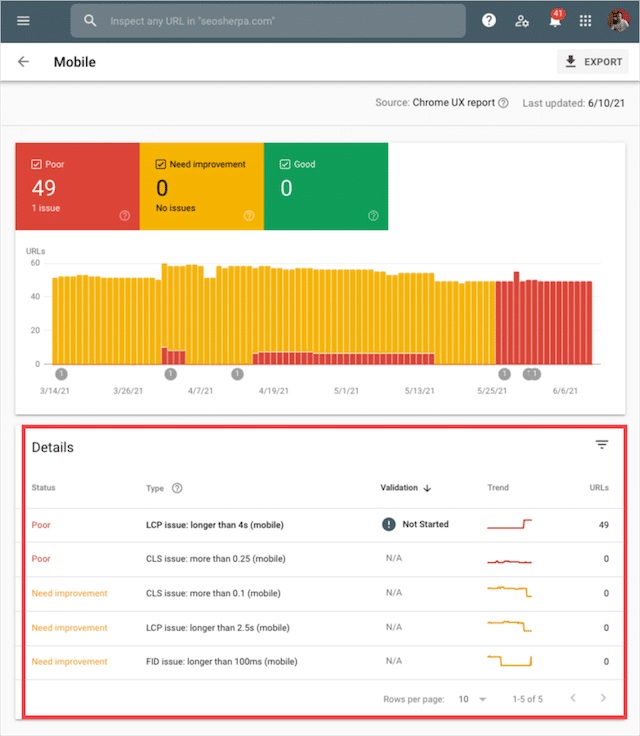
Click further into the report and you can find details of the specific issues and a list of the URLs that are affected.
While improving Core Web Vitals for mobile AND desktop devices makes for a better all-around user experience, Google uses only the mobile signals for ranking pages.
That’s because Google recently switched to 100% mobile-first indexing, which means they use the mobile version of your site for rankling evaluation.
Why Are Core Web Vitals Important?
No one can know just how much of an impact Core Web Vitals will have on Google rankings – at least not yet.
That said, judging that Google’s pre-warned web admins one year ahead of the release ****, the search engine is taking Core Web Vitals seriously.
You should too. Here are three reasons why:
(1). Core Web Vitals as a Ranking Factor
As of June 2021 page experience is an official Google ranking factor.
Page experience combines several factors that Google considers important for user experience, such as:
- HTTPS.
- Mobile-friendliness.
- Lack of interstitial pop-ups.
- “Safe-browsing” (e.g., not having malware on your pages)
Plus, Core Web Vitals!
While we do not know how much weight is given to each of these factors, judging by the name alone, it’s fair to say that core web vitals make up a vital part of your total page experience score.
But, remember this:
Nailing page experience won’t magically thrust you to the #1 spot in the rankings.
Google uses hundreds of factors to assess and rank sites in search. Page experience is just one of them.
Google also points out that, page experience doesn’t override having great page content.

In other words, if your content is the best match for a search query, you might get a free pass if your core web vitals are poor.
On the other hand, if your content is equally matched to competitors (in terms of quality and relevancy), page experience could be a deciding factor.
What am I getting at here?
For highly competitive keywords, core web vitals is critical.
For low competition keywords, I suspect it’s less of a concern.
(2). Core Web Vitals and CTR
The jury is out on Core Web Vitals as a direct ranking factor.
We simply don’t yet know how much weighting it’s given compared to other signals.
However, its impact as an indirect ranking factor cannot be argued if page experience badges come about.
What are page experience badges, you ask?
Google hinted they’re currently working on visual indicators to identify pages that meet all of the page experience criteria.
And, these visual indicators would be displayed front and center as a SERP feature.
This might mean that if your page fails the core web vital criteria, a label displaying “poor page experience” could be shown alongside your listing on the search results page.
That could be disastrous for CTR.
Which as SEO experiments have shown, is a big influence on rankling position.
Thanks to a discovery by JR Oakes, we know page experience badges are likely.
As you can see, Google is not just considering page experience badges, they’re actively preparing for this feature.
If you want to positively influence searcher behavior by showing a “good page experience” badge to users – it makes sense to have your core web vitals in order.
(3). Speed Matters
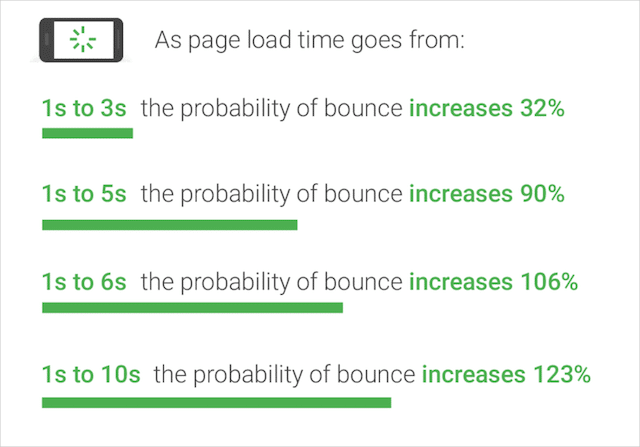
The data is clear, users **** fast websites.
Not only do visitors buy more from quick-loading pages, and return to them more often.
They are WAY less likely to bounce off a page when the page is fast to load.
In fact, in a recent study of millions of page impressions, Google found that sites meeting Core Web Vitals thresholds were 24% less likely to experience abandonments before full page load.
So while there’s a lot of hype about core web vitals as a ranking factor, SEOs are missing the point.
The reason to address core web vitals is not just to rank higher, but because it’s better for user experience overall.
How is Core Web Vitals Measured?
Core Web Vitals are measured using real world data.
In other words, the actual experience users have interacting with your web pages.
Core Web Vital scores are not measured using simulations, they use data gathered from genuine Google Chrome browser sessions.
Why that’s important?
When it comes to Web Vitals, there are two types of data you can look at – field data and lab data.
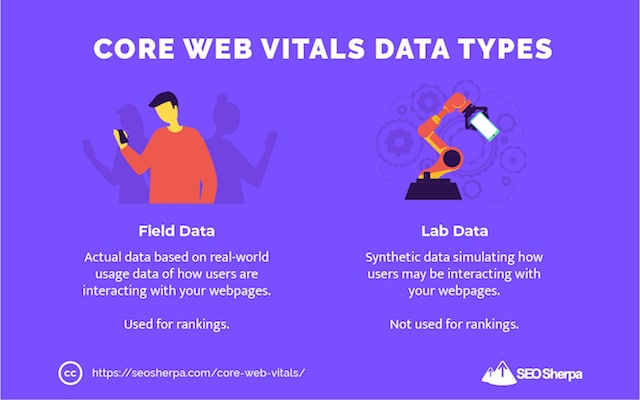
Field data is collected from real users, each with their unique device and network connection, through the Chrome User Experience Report (“CrUX report” for short). It’s data on how users are actually interacting with your web pages.
Lab data is collected within a controlled environment with predefined device and network connection settings, without any involvement from real users. It’s synthetic data simulating how users may be interacting with your web pages.
Google uses field data to asses web vitals.
Let that sink in.
You could see great scores for your Lighthouse reports (lab data) and be crowning yourself as the core web vitals king, while your actual users are having a shoddy user experience (field data).
Here’s a list of tools and the data they use:
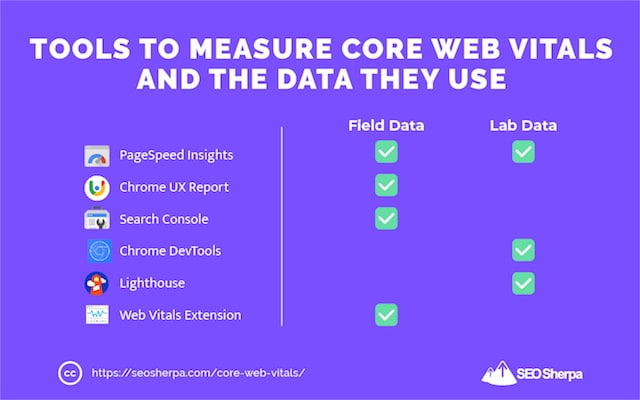
Now, I’m not saying only look at field data. The challenge with field data is that it is aggregated over 28 days – which means when you optimize your Core Web Vitals, using field data, you’ll not know if your optimizations worked for 4 weeks.
Thats a helluva long time to wait.
That’s why lab data such as Lighthouse, Chrome Dev Tools, and GT Metrix are useful. They give you an instant snapshot of your likely page experience.
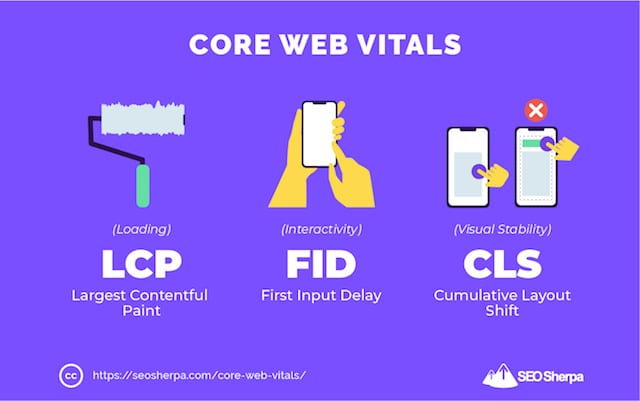
The Three Components of Core Web Vitals
Here are the three current components of Core Web Vitals:
Let’s break each one down in detail:
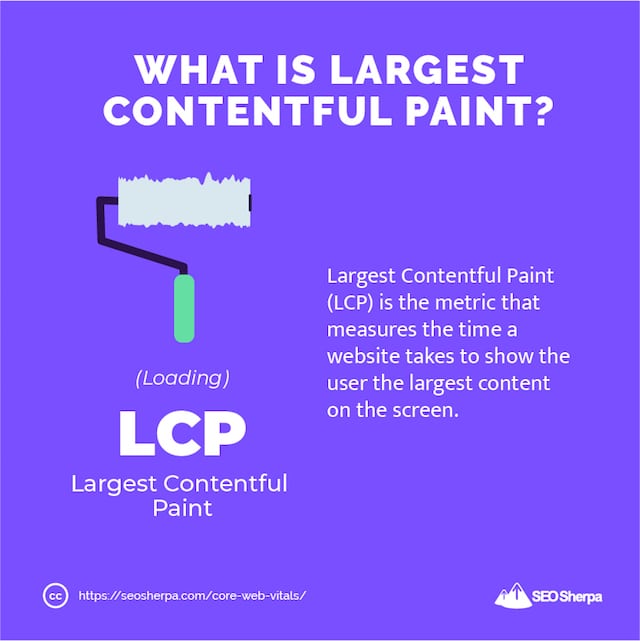
Largest Contentful Paint – Loading
The Largest Contentful Paint (LCP) is how long it takes for a page to load from the point of view of a user.
It’s basically the time between a user clicking on a link and them seeing the majority of the content on their screen.
LCP is assessed by measuring the actual load time of the largest content piece in the viewport.
That’s typically a featured image or maybe the h1 tag, but could be any of these:
- <img> element
- <image> element inside an <svg> element
- The image inside a <video> element
- Background image loaded with the url() function
- Blocks of text
<svg> and <video> may be added in the future.
The Largest Contentful Paint is different from other page speed measurements.
That’s because page speed metrics (like Time to First Byte and First Contextual Paint) don’t represent what it’s like for a user to open a webpage.
On the other hand, LCP focuses on what matters most when it comes to page speed: a user being able to see – and subsequently interact with a page.
How to Measure LCP
You can check your web pages LCP using PageSpeed Insights.
What I really like about Google Page Speed Insights is that it provides actionable ways to improve your LCP score.
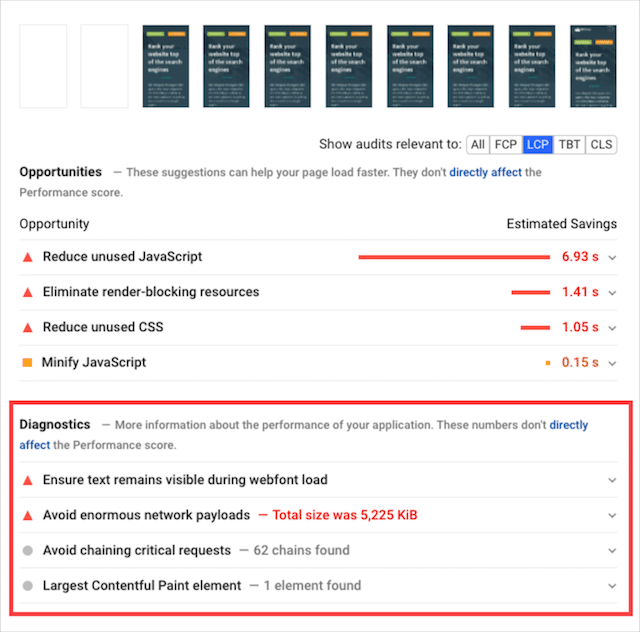
What’s also neat about using Pagespeed Insights over a tool like webpagetest.org is that you get to see how your page has performed in the real world (based on actual Chrome browser data).
With that said, I also recommend looking at your LCP data in Google Search Console.
Why?
Well, like Google PageSpeed Insights, the data in Search Console comes from the Chrome User Experience Report.
But unlike PageSpeed Insights, you can see LCP data across your entire site.
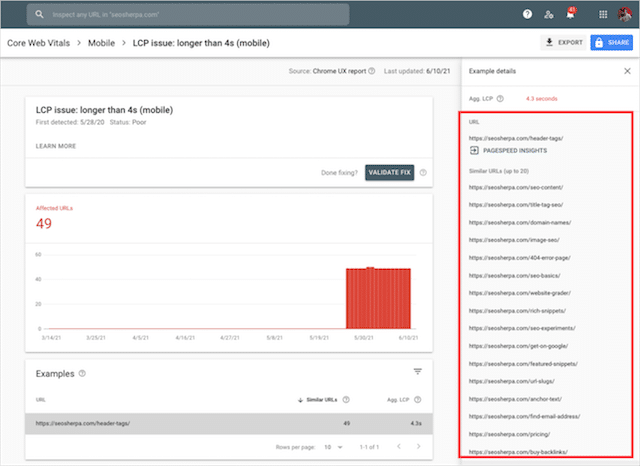
So instead of analyzing random pages one by one, you get a list of URLs that are good, bad… or somewhere in-between.
Once, you’ve identified the pages that need improvement, you can head over to PageSpeed Insights to understand what you need to address.
Understanding Your LCP Score
Like all its core web vital metrics, Google breaks down Largest Contentful Paint into three buckets: Good, Needs Improvement, and Poor.
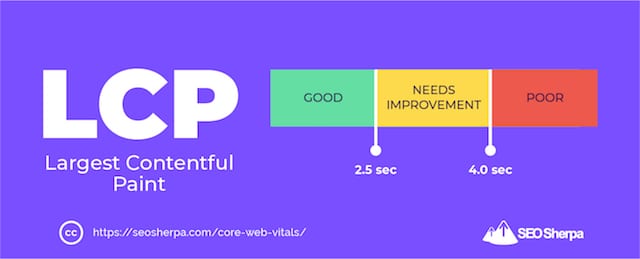
- Under 2.5 seconds = Good
- 2.5 to 4 seconds = Needs improvement
- Above 4 seconds = Poor
This means, your goal for LCP is to have every page on your site load within 2.5 seconds.
Easier said than done.
Take this post on our blog. It contains dozens of custom images and is SUPER long.
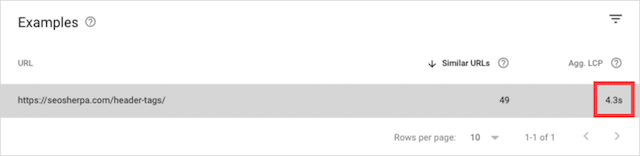
That’s why the LCP is 4.2 seconds (which is considered “poor”).
I’m not making excuses, but it goes to show that improving LCP isn’t as simple as installing a caching plugin or using a CDN (both of which we’ve done).
With that, here are some things you can do to improve your site’s LCP.
Optimizing LCP
There is a bunch of things you can do to improve your LCP score. Here are my top-3 recommendations.
Defer JavaScript
Render-blocking resources like JavaScript files are one of the main culprits of a bad LCP score.
They get in the way of HTML files and slow down the page rendering process.
To address this problem, I recommend you defer the loading of JavaScript files till later. This ensures the HTML files which house your content gets loaded first – and your LCP time improves.
Optimize Your Images
Optimizing images can fix a bad LCP score.
That’s because, for many website designs, a featured image is the LCP element. By improving the load time of featured images, you’ll boost the Largest Contentful Paint performance.
Here’s what you can do to optimize your images for faster load times:
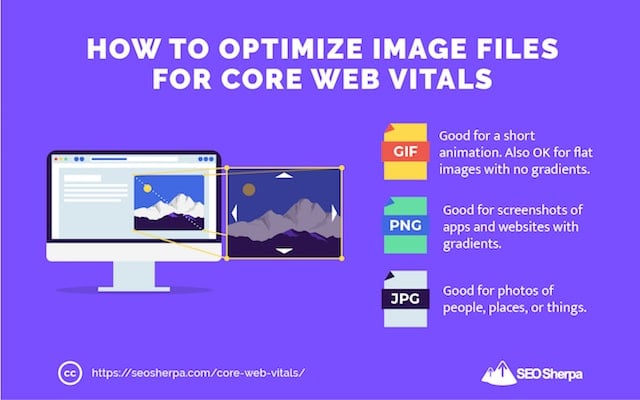
- Compress and resize your images. You want to reduce the file size without losing quality. The smaller the image dimension is, the faster the loading time will be.
- Convert your images into new formats. Google recommends the WebP format for fast loading. Most WordPress image optimizer plugins like Imagify now include the option to convert images to WebP.
- Use responsive images. You shouldn’t use the same image size for desktop and mobile. Instead, you should upload image sizes appropriate to each device type (desktop and mobile).
Compress Text Files
To score better for LCP, you should also compress text files such as HTML, CSS, or JavaScript resources.
Essentially, you want to “zip” your files in a smaller and lighter format so they load faster.
Once you reduce their size, the transfer between browser and server will be quicker.
In turn, the browser will load those resources faster and LCP will improve.
LCP Resources
First Input Delay – Interactivity
Next, we’ll examine Google’s second Core Web Vital: First Input Delay.
At this point, your content has loaded (FCP).
But is the page interactive yet?
Well, that’s precisely what First Input Delay measures: the time from when a user interacts with your page until the page actually does something.
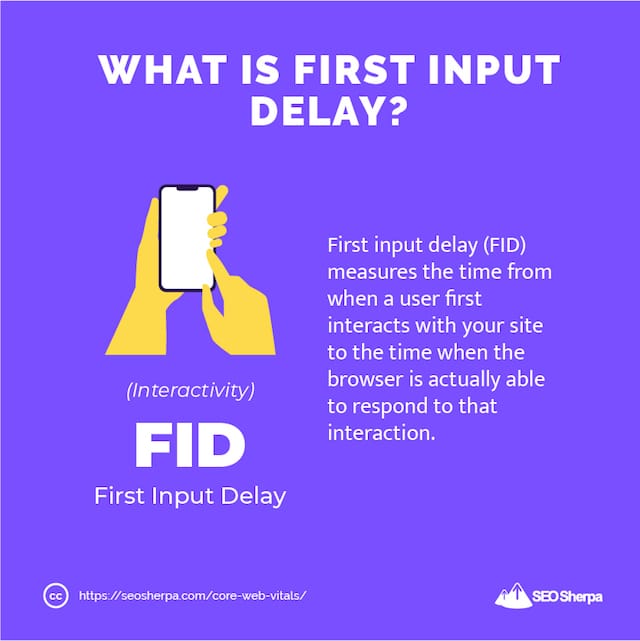
Put another way; FID is page responsiveness.
Some of the interactions that are measured for FID are:
- Clicking on a link or button
- Choosing an option from a menu
- Clicking a checkbox
- Entering text into a field
In short, when users do any of these things – your page should respond right away.
How to Measure FID
FID is a “field” metric. In other words, it scores how responsive your page is in the real world.
Because of that First Input Delay can only be measured by a few tools that use in the field data:
Like with LCP, I recommend you use Google Search Console to identify the pages on your site with FID issues:
Then use Pagespeed Insights to understand what you need to address on each specific page.
Note that Page Speed Insights will not give you actual FID recommendations. However, it does provide Total Blocking Time issues which closely correlate with First Input Delay.
Improve TBT, and your FID will invariably get better.
Understanding Your FID Score
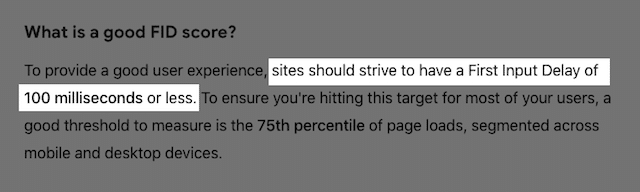
According to Google’s FID criteria, your page should respond in 100ms or less:
Here’s the breakdown of FID times by band:
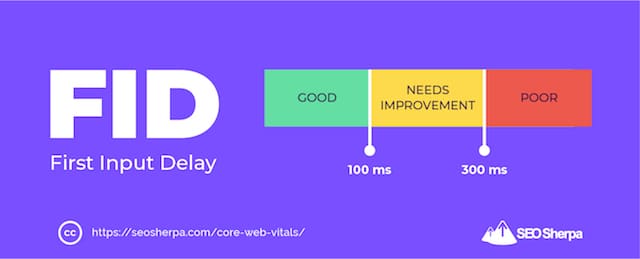
- Under 100 milliseconds = Good
- 100 to 300 milliseconds = Needs improvement
- Above 300 milliseconds = Poor
Obviously, it’s a bad user experience if visitors try clicking something on a page and nothing happens. Google understands that, which is why interactivity (e.g., FID) is a core web vital.
Still, you should remember, not all users interact with a page.
For instance, if the page is made up of content (like a blog post or article), the only real “interaction” a user has is scrolling – which doesn’t qualify for FID.
So what causes First Input Delay (FID)?
Almost always; JavaScript.
To explain it simply:
A browser processes requests on one main thread. If that thread is occupied by heavy JavaScript files, it can’t process other requests, including requests from users.
This means if a user makes a request (like clicking a button) the browser will not process the request until the JavaScript has finished. Hence the delay.
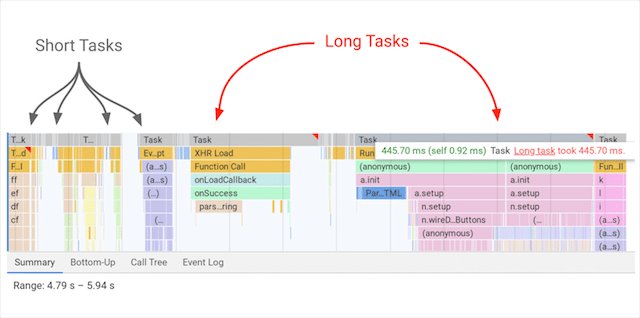
Source: Web.dev
The longer the task, the longer the delay experienced by the user.
On the other hand, if the browser is only processing short tasks, with frequent breaks in between, it can switch to the user’s task and respond to what they wanted.
Optimizing FID
In general, you want to break up long tasks into smaller ones and defer any JavaScript that isn’t needed until later.
Here’s the two main way to optimize JavaScript for better FID performance.
Defer JavaScript
When you defer JavaScript, you are essentially delaying the loading of these render-blocking resources until the browser has rendered the content needed for users to interact with the page.
As a result, the loading time will improve, as well as the FID grade.
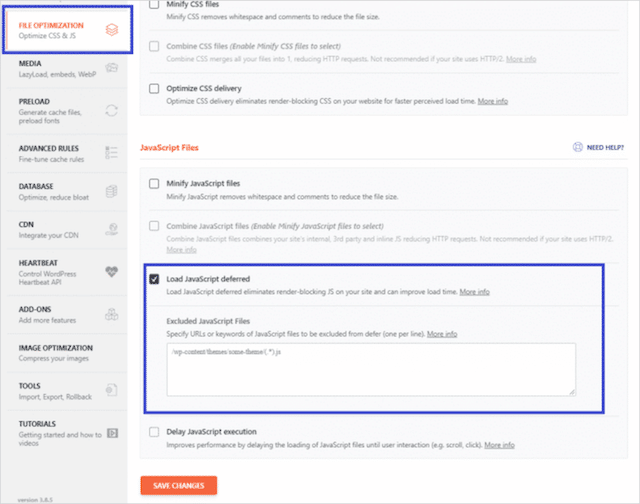
Once you have identified the JS resources to defer, add this defer attribute to the JavaScript files:
<script defer src="https://seosherpa.com/example-js-script"></script>This attribute tells the browser to defer processing these files until the page rendering is complete.
If you are using WordPress, simply install WP Rocket, it makes this process real simple:
Break up Long Tasks
As I already explained, when the main thread is busy and blocked, the page can’t respond to user inputs – and the FID grade is affected negatively.
To solve this issue, you should split long-running scripts into smaller chunks that can each be run in less than 50ms. Splitting up long tasks ensures breaks between tasks where user inputs can be processed.
Why 50ms?
Because a “good’ score for FID is below 100ms.
If your tasks are no longer 50ms, then you should be able to achieve that score comfortably.
FID Resources
Cumulative Layout Shift (CLS) — visual stability
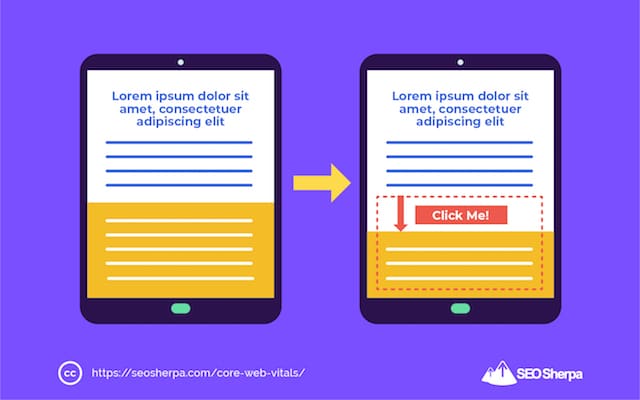
Cumulative Layout Shift (CLS) is how steady a page is. In other words “visual stability”.
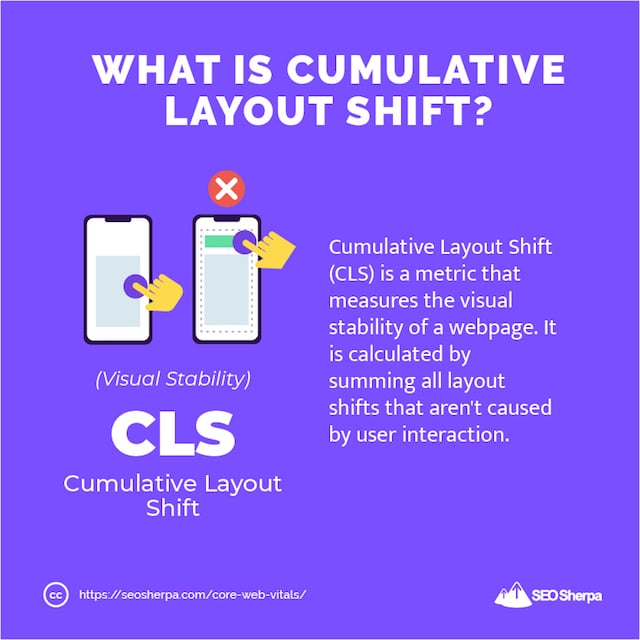
If elements on your page move around unexpectedly as the page loads, then you’ve got a high CLS – and that’s bad for the page experience!
From a user’s standpoint, let’s say they try to click the navigation, and the page shifts. They end up clicking something they didn’t intend to and get navigated to the wrong page. It’s massively frustrating.
Common causes of CLS include:
- Images without dimensions
- Ads, embeds, and iframes without dimensions
- Injecting content with JavaScript
- Applying fonts or styles late in the load
Unlike LCP and FID, Cumulative Layout Shift (CLS) isn’t measured in seconds.
Instead, it measured by the degree of movement between two unstable elements in the viewport – the viewable area of the page.
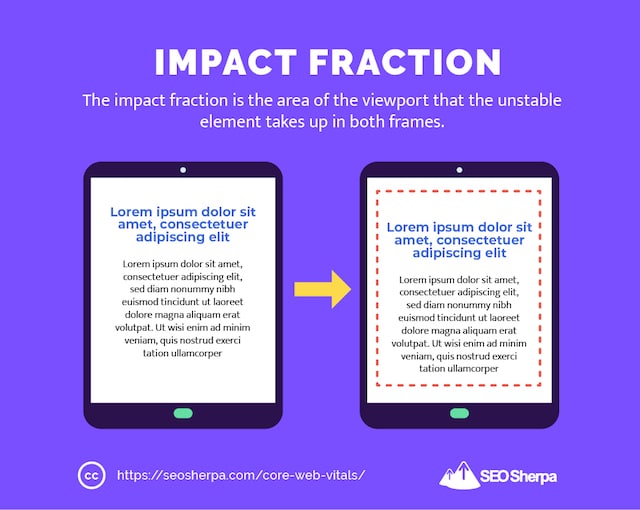
The layout shift score is a product of two components: the “impact fraction” and the “distance fraction”.
The “impact fraction” is the area of the viewport that the unstable element takes up in both frames:
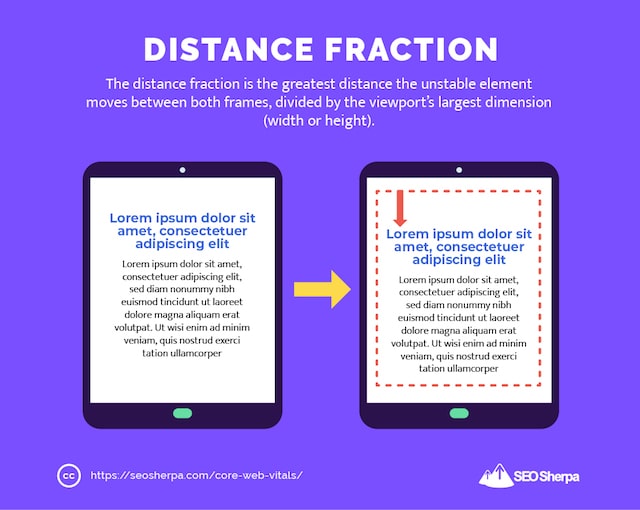
The “distance fraction” is the greatest distance the unstable element moves between both frames, divided by the viewport’s largest dimension (width or height):
To be honest, you don’t need to know exactly how the CLS score is calculated.
But you absolutely need to know how to find your CLS score and address poor-performing pages.
We’ll cover that next:
How to Measure CLS
In PageSpeed Insights, under Diagnostics, you can select audits relevant to CLS. This will show you a list of the elements that are shifting.
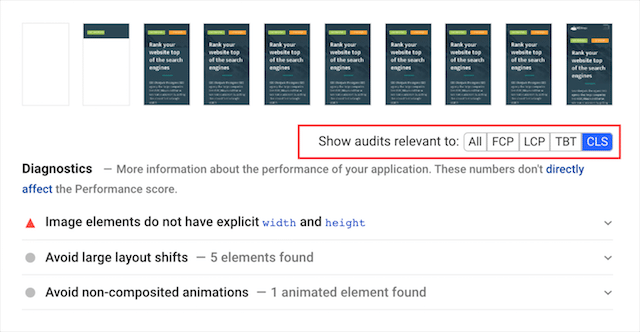
However, Page Speed Insights is not good for visualizing what’s actually moving.
For that, I recommend this Layout Shift GIF Generator tool:

You can also use WebPageTest and a mobile device simulation (I chose iPhone X), in Filmstrip view with the following options:
- Highlight Layout Shifts
- Thumbnail Size: Large
- Thumbnail Interval: 0.1 sec
Notice how the block of content below our headline changes layout at 2.4 seconds.
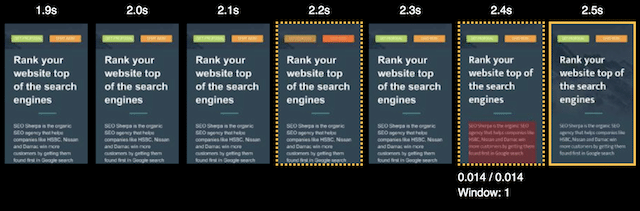
Layout shifts like this should be avoided.
Understanding Your CLS Score
As I explained, the Cumulative Layout Shift is the sum of all the unexpected content shifts occurring on the page.
Here are the specific criteria Google has in place for CLS:
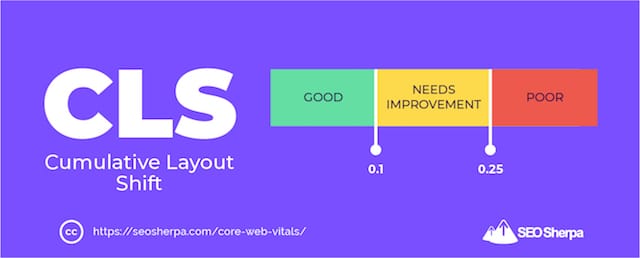
- Under 0.1 = Good
- 0.1 to 0.25 = Needs improvement
- Above 0.25 = Poor
In other words, you need to nail a CLS of sub 0.1 to pass core web vitals.
Optimizing CLS
Unexpected layout shifts mostly occur due to images or ads having undefined dimensions.
Or, new elements getting added to a page, above existing content that has already been loaded.
This results in content that has already been loaded being pushed away.
And, the page moving around like CRAZY.
Here are the top-3 things you should do to stop CLS from occurring:
Add Width and Height Size Attributes to Images and Video Elements
One of the simplest ways to fix CLS is to include the width and height attributes on your images and video elements.
In most CMS this will be set automatically:
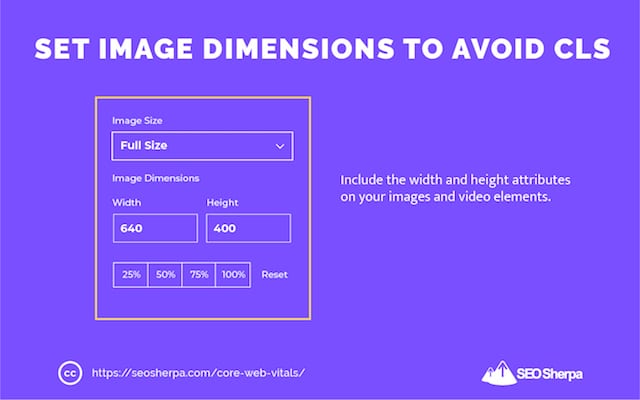
But just in case your CMS does not do this by default, you should include the width or the height attribute aspect ratio using CSS.
Define Space and Size for Ad Slots, Embed and iFrames
There are several best practices to avoid any layout shift for ads, embeds and iFrames:
- Assign fixed dimensions to ads, so there’s enough space reserved for the element to be loaded.
- Keep the biggest possible space for ads, embeds, and iframes. If space is smaller than is needed, a layout shift will happen when the ad, embed, or iframe gets loaded.
- Keep every space reserved for elements that have not been displayed. In other words, you shouldn’t collapse any area on the viewport. Instead, include a placeholder or a fallback element.
Manage Dynamic Content
Dynamic content such as banners can also affect Cumulative Layout Shift.
That’s why I recommend you avoid displaying new content unless it’s triggered by user interaction.
CLS counts only the layout shifts that occur when users are not interacting with the page.
Which means:
Dynamic content triggered by users = OK
Dynamic content not triggered by users = Not OK
CLS Resources
Best of the Rest: 5 Practical Steps You Can (and Should) Take to Ace Your Core Web Vitals
Now we’ve addressed specific core web vita issues, relating to LCP, FID, and CLS (and how to fix them).
Next, I’m going to share five core web vitals best practices that you should have in place, regardless of whether your websites scores good, poor or needs improvement for core web vital metrics.
Implementing these will ensure you excel for page experience signals, now and in to the future.
Let’s jump in:
(1). Speed Up Server Response Time and Accelerate TTFB, LCP and FID
Most people assume that speeding up a server influences only Time to First Byte (TTFB).
But, the longer it takes a browser to receive content from the server, the longer it takes to render anything on the screen.
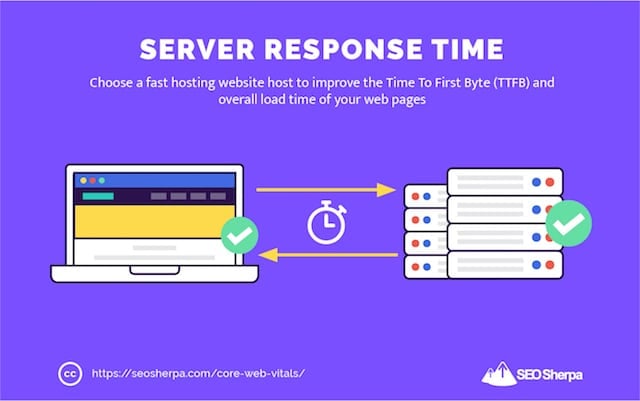
Which means, a faster server response directly improves not just TTFB, but every single page-load metric, including LCP and FID.
To improve server speed, the single biggest thing you can do is switch to faster hosting.
If you’re on that $9 bucks a month shared hosting plan, it’s time to move.
Cloudways is my go-to hosting recommendation these days. It’s lightning-fast and offers dedicated environments for all manner of CMS.
But there are many more options:
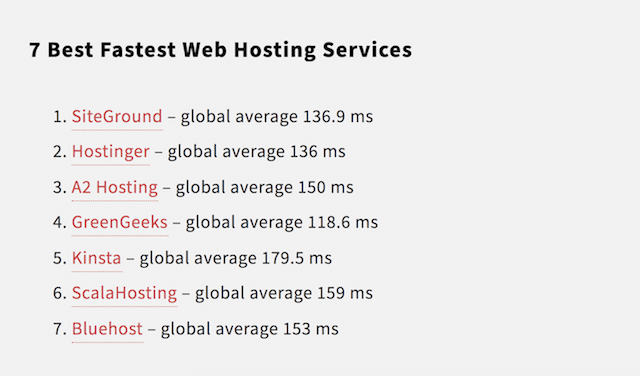
Whatever you opt for, make sure it’s as fast as possible.
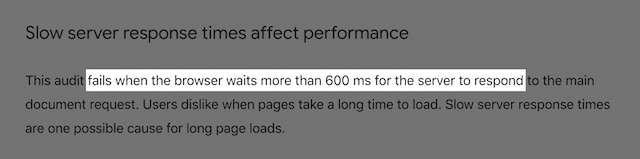
Anything above 600 milliseconds is considered slow by Google.
(2). Leverage a Content Delivery Network (CDN) and Load Your Pages 2X Faster
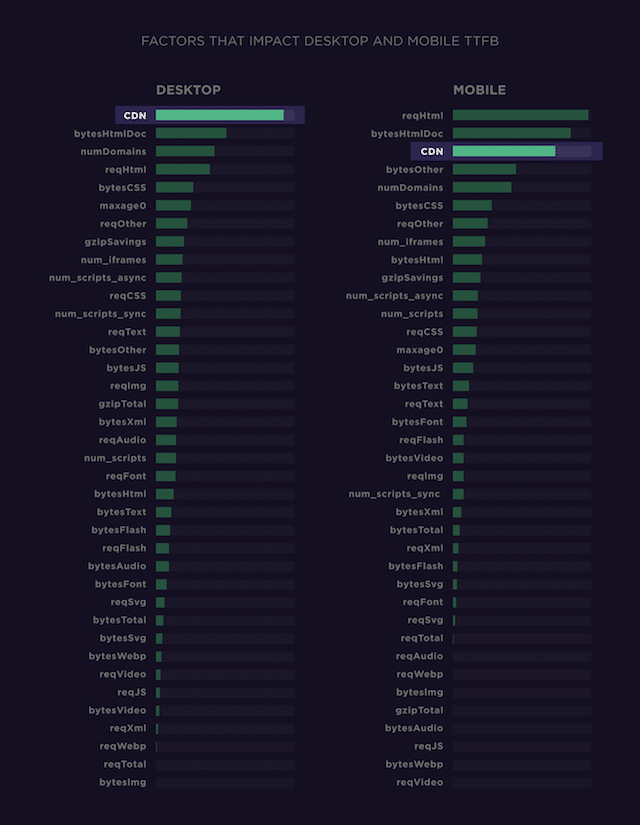
Pages using a CDN load as much 2X faster than pages without a CDN.
Infact, installing a CDN is the number one thing you can do to improve initial response time.
At least if this data by Backlinko is anything to go by:
But wait, what does a CDN do?
A Content Delivery Network (CDN) improves the availability of your images by serving them from locations near to users. In other words, instead of serving your images from a central server, a CDN stores a cached version of your images in multiple geographic locations, known as Points of Presence (or POPs for short):
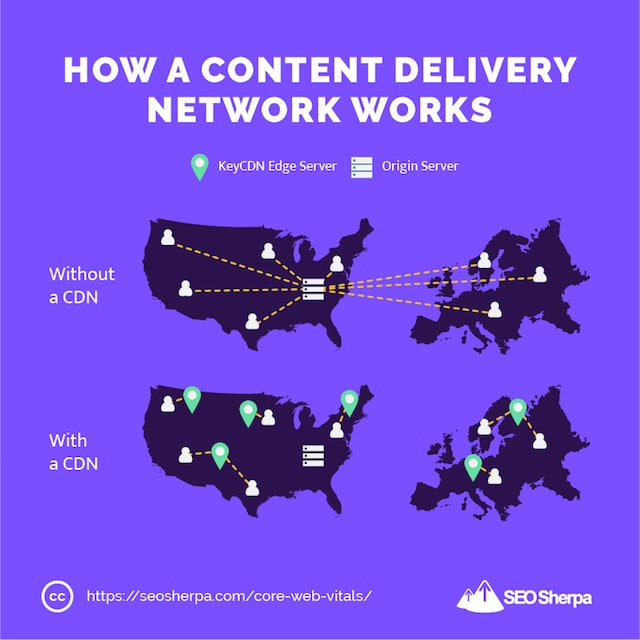
Because your content is served from POPs close to the user (and not on a server thousands of miles away), they load way faster!
This is especially important for core web vitals.
To get a “good” score for largest contentful paint, you need your largest content element to fully load in under 2.5 seconds.
As I already pointed out, the biggest content element on a page is very often the featured image.
Which brings me to my next point.
(3). Implement Lazy Loading to Serve Only What’s Necessary
If you use lots of images in your posts, then there’s a high chance they’re affecting your page load time – unless you’re using lazy loading that is.
Instead of all images being loaded at once, lazy loading serves images only when they’re needed.
In other words, when the users scrolls to that point in the page:
The idea here is to shorten the length of the critical rendering path, or the length of time it takes the user to reach the page’s Largest Contentful Paint (LCP).
Google has several resources explaining how to implement lazy loading, but if you, like me, are not a developer, it’s kinda complicated.
For that reason, I recommend using a lazy loading plugin.
Here’s two to check out:
Once you’ve picked one of them, move on to core web vitals action step #4.
(4). Use Full Page Caching to Boost Your Core Web Vitals
This one is easy.
To reduce server response time (or, Time To First Byte) install and configure a caching plugin.
I suggest:
WP Rocket, WP Fastest Cache or W3 Total Cache in that order.
My vote goes to WP Rocket because it’s easier to set up than others.
But, to be honest, it doesn’t matter much which you choose, they are all close in terms of performance:
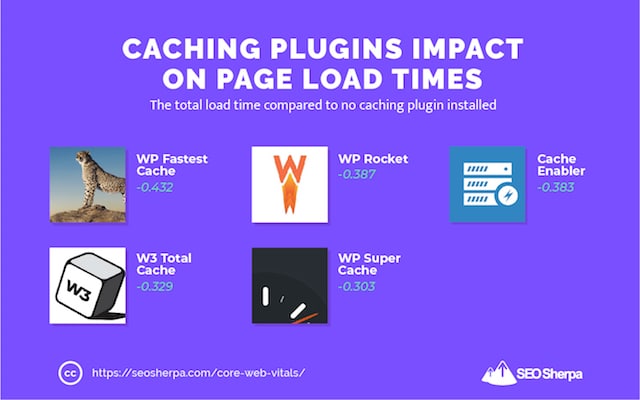
I’ll not go into detail here, just know that caching is the idea of storing important data in an accessible spot so that it can be more quickly served to visitors.
As you see above, caching can shave off nearly half a second from load times.
Great for core web vital improvements.
(5). Load Your External Scripts Till Later
External scripts destroy your load time.
Which is why I recommend you remove all but the scripts you absolutely require on your website.
And the ones that are really necessary? You defer their loading till after the main page content.
If you use WordPress, simply install the Perfmatters plugin, then add all your scripts in the Delay Javascript section:
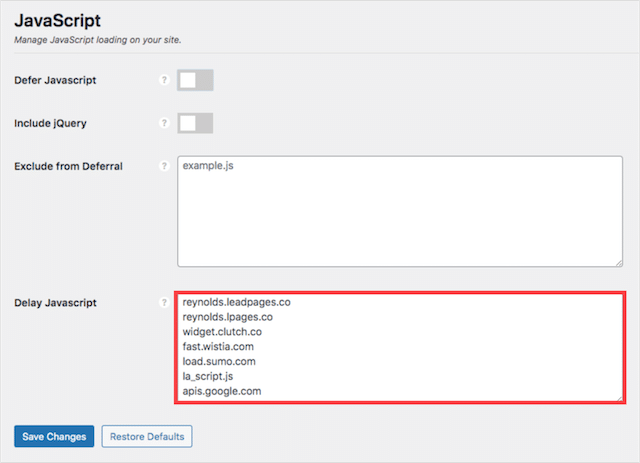
For me that’s scripts like Wistia which I use for video’s on my website, and Google Analytics.
And by delaying them, I shaved vital milliseconds from my load time.
Final Thoughts
If you haven’t got your core web vitals in order, don’t freak out!
Google is rolling out the page experience update gradually.
“You can think of it [page experience] as if we’re adding a flavoring to a food we’re preparing. Rather than adding the flavor all at once into the mix, we’ll be slowly adding it all over this time period.”
In summary, you’re not likely to see a huge impact from Google’s core web vitals update initially, but it’s likely you will over time as Google dials up core web vital requirements.
Which means, whenever you are reading, start now.
The longer you leave core web vitals unattended, the more you’ll be impacted over time.
That’s why I’ve created this special core web vitals bonus for you.
It’s a simple checklist containing 7 action steps you need to take to pass core web vitals. Includes 2 strategies not contained in this post. Download it below – it’s free.