
Posted by
Darrell Mordecai

Important question. How many businesses have blogs and produce content?
Now, this follow-up question might be a little disturbing…
How many businesses actually track their content marketing success?
There is no question that effective tracking is crucial. I mean, would you run paid ads without knowing how effective your ads are? The same is true of your content marketing.
The problem is content marketing usually requires many steps before resulting in a sale. This makes it difficult to track. You first need to visualize your sales funnel by taking all stages of the funnel into consideration. You can then find Google Analytics metrics to measure the success of each step.
In this post, I’ll show you how to use Google Analytics for content marketing.
Defining The Goal of Blog Content
Before getting into the specific metrics I need to first establish what your blog content is supposed to achieve. Simply put, a blog is far more than an SEO tool designed to bring organic traffic to your site.
Your blog should establish your brand as an authority in your niche by successfully answering their questions and giving helpful advice.
Also, your blog is a powerful way for your brand to interact with your audience. If done right, your audience will consider your blog their ‘go-to’ source of reliable information for your niche. In building this relationship with your audience, you’re building trust.
Once you understand this, it becomes obvious that tracking your blog is not just about tracking organic traffic, it’s also about tracking how your audience interacts with your content.
Google Analytics data can give you all of these engagement metrics.
Let’s dive in…
Google Analytics Engagement Metrics
Although it isn’t perfect, Google Analytics metrics can give you a wealth of information that can be turned into actionable insights. For instance, you can use the data to show you:
- What content to focus on
- Whether your readers are consuming your content
- Whether they are looking at more content once they finish reading a blog post
- Whether they come back
In order to help you understand how to use the data, I’ll share some key metrics you should be focusing on. I’ll not only show you the metrics, but I’ll also tell you what story the data is telling you.
Page Views
The first place to look at is page views. Page Views simply tells you how many people are looking at your content. You can access the Page Views report by going to Behavior > Site Content > All Pages.
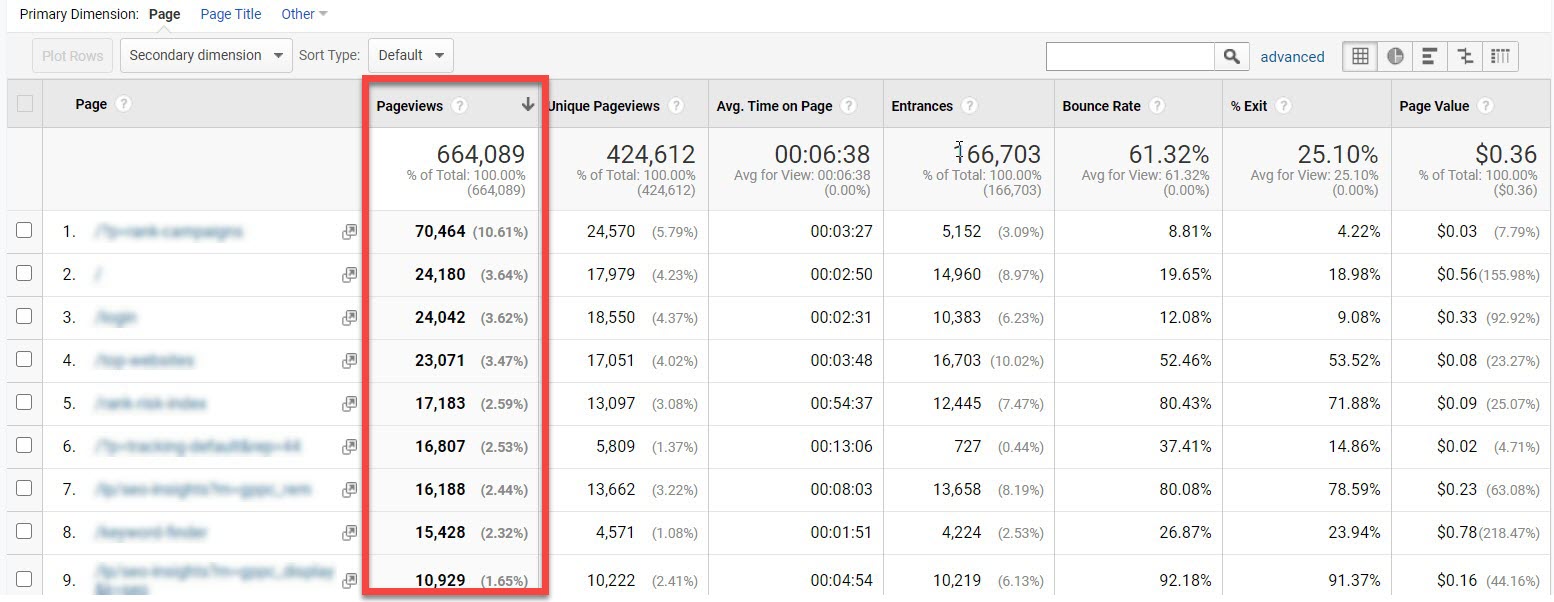
Now, before I get into the insights you can glean from this data, I have to first point out that this report will show you data for all of your pages. In order for it to give you insights into how to improve your blog, you must filter it to only show blog content.
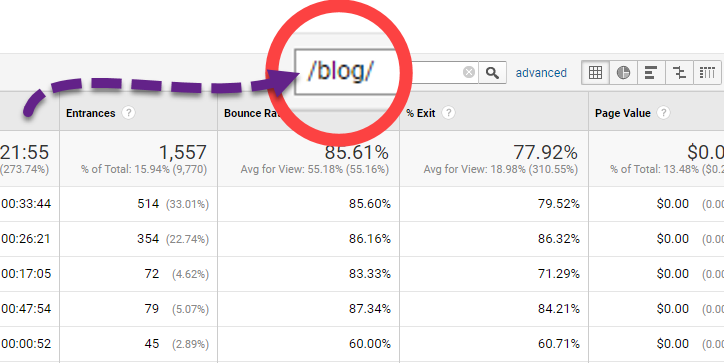
If your blog is in a separate folder called /blog/, filtering only blog content is easy to do. Simply add ‘/blog/’ to the search bar.
If you are not able to create a filter in Analytics, you have to download the data and filter it in Excel.
Page Views Insights
Now that you can see how many views your pages are getting, you might be wondering how this tells you how to create successful blog content.
Use this report to understand which topics are popular and which are not. In other words, look at your pages with the most Pageviews over time. These pages perform better than your other content.
Can you see an obvious trend or pattern?
For instance, are your top pages all focusing on a specific subtopic? If so, perhaps you should double down and create more content dealing with this subtopic.
Now I have to point out that this is a simplified look and to truly understand why these pieces of content are getting the most views, you will need more context.
The Average Time on Page metric can give you more insight…
Average Time on Page
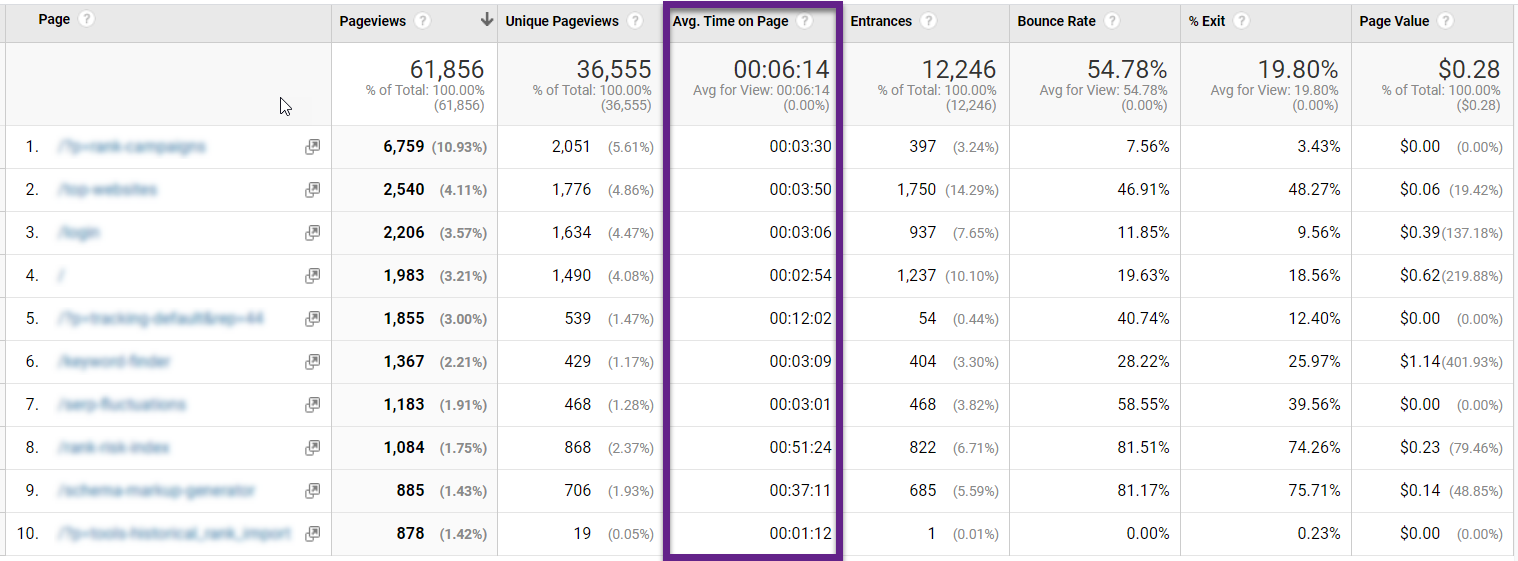
Average Time on Page is a useful metric because you get to see if your viewers are actually reading your content. Before you can do that, you need to first understand how long it takes to read your content.
There are many different factors that define how long it takes for a user to read a blog post.
To understand this, you’ll have to look at each piece of content separately and estimate how much time it takes to read. Use this number as a benchmark and measure the Average Time on Page against your benchmark.
So for instance, if you estimate that it takes three minutes to read your average piece of content and your Average Time on Page is fifteen seconds, you know that your audience is not finding what they are looking for in your content.
Once you find blog posts that are not performing well, you should try to look at your content through your reader’s eyes.
Ask yourself:
- Is the content easy to read?
- Does it get to the point?
- Is it confusing?
- Does it satisfy the user’s intent?
- Is it truly helpful?
Once you’ve gone through your weakest content and figured out why it performs that way, you can look for trends. Are there similarities between your worst performing content? What about your best performing content?
You can use these trends to improve your overall content.
Now, if you want more context about your content, try adding a Source / Medium as a secondary dimension.
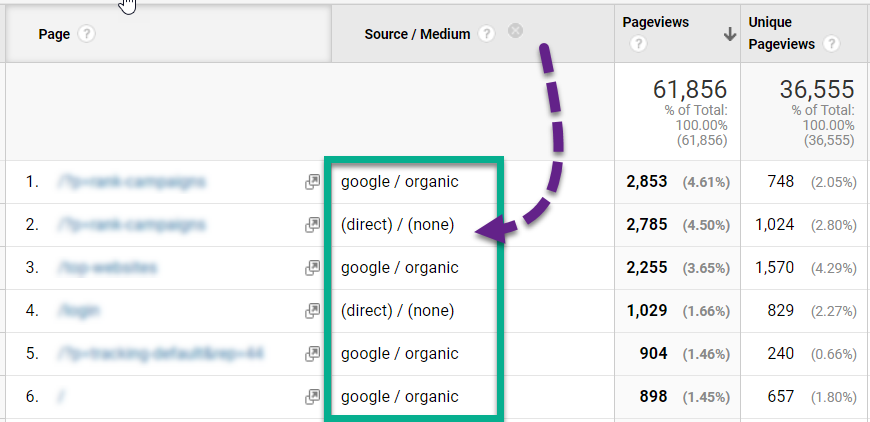
Source / Medium
By adding a ‘Source / Medium’ as a secondary dimension, you will now see where your Pageviews are coming from.
To do this, click on the secondary dimension dropdown and type ‘Source / Medium’ into the search bar.
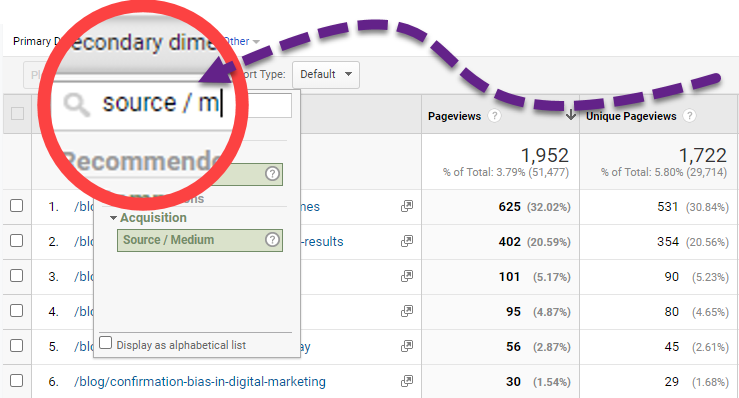
Once you are there, the report will now show you where your page traffic is coming from. In other words, did it come from:
- A referral?
- Google / organic?
- Direct?
Now you may be wondering why this is important to your content.
You can use this data together with Average Time on Page to understand how your different audiences relate to your content.
For instance, often a Google organic audience spends a long time on a page, say 20 minutes, but a social media audience spends a short time, say 15 seconds, on the same piece of content.
On the one hand, this could be a result of the social media audience clicking a link and not finding what they were expecting. To remedy this you must make sure your social media doesn’t create misaligned expectations.
On the other hand, Google organic traffic tends to be a much more motivated audience. They asked a question in a search engine and expect to find an answer. A social media audience is not looking for content but incidentally they might click. Can you make your content more appealing to your social media audience?
Now that you understand how your different audiences are interacting with your pages, you can glean some insights by seeing your Average Pages Per Session…
Pages Per Session
To see how many pages your audience viewed per session go to Behavior > Site Content > Landing Pages. This report will show you if after visiting your page, your audience viewed more pages, or if they left after reading one page.
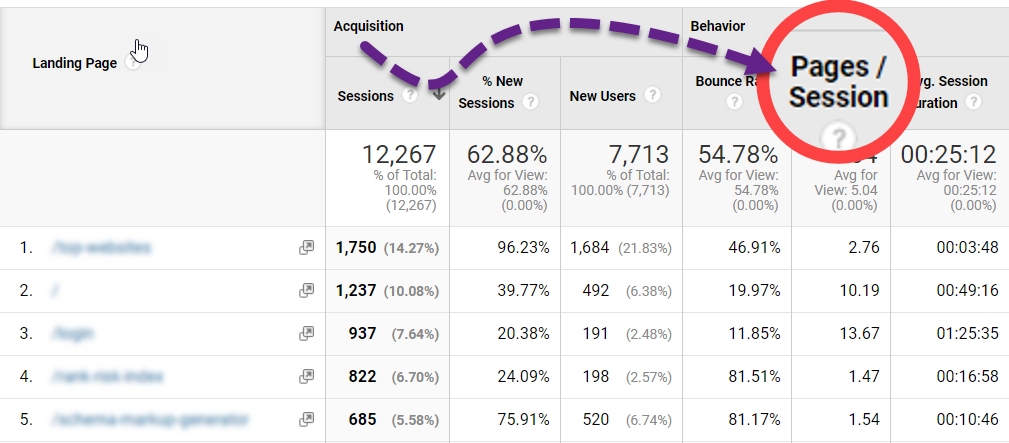
The reason this metric is so important is blog content is usually top of the funnel content. This means your audience might be discovering your brand for the first time. What’s more, they most likely discovered your brand by searching Google for an answer to a question. They may have no intention of becoming a client or customer.
This means if you want them to buy something or hire you, your ‘go-to’ strategy is to engage them further. This will establish your brand as authoritative and will help to create a relationship with them.
If you see that your Average Pages Per Session is low, you should actively look for ways to inspire users to click through to more content.
There is more than one way to do that.
You could:
- Have visible links and CTAs on your blog posts, encouraging clicks to other blog posts.
- Create content in multiple parts. If the content is good enough, your audience might be compelled to click through to part two.
If you are unsuccessful in inspiring your audience to click through to more content, all is not lost. Who knows, maybe your audience intends to return to your site at a later ****…
Cohort Analysis
An important question to ask is what percentage of your audience returns after reading one of your posts? To find this out, go to Audience > Cohort Analysis.
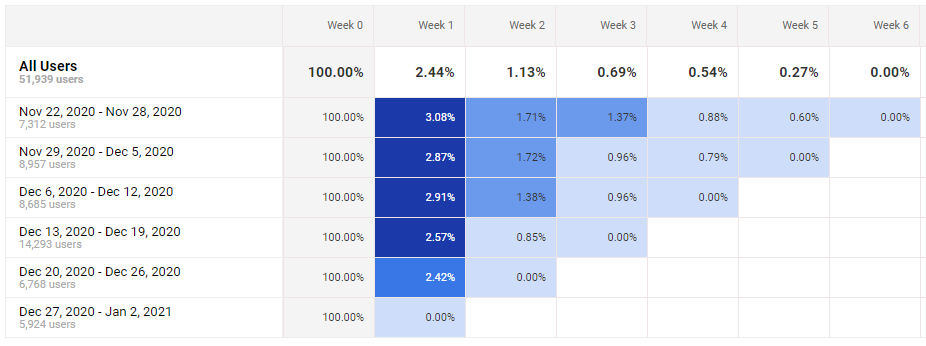
This means you can quickly see if your audience is coming back to consume more content. If your audience is not coming back you might easily increase sales or conversions by encouraging them to come back.
There are some simple strategies to get your audience back.
You can:
- Set up an email opt-in
- Run a push campaign
- Run remarketing ads to your blog audience
- Create multi-part blog content that covers broad content over a number of posts
Once you have improved these metrics, you should also see if Google understands your content as relevant to your audience’s search intent.
Landing Page Traffic Insights
This next report, the Landing Page Traffic Insights, exists in the Rank Ranger rank tracking reports. It presents Google Analytics organic traffic data together with Google Search Console data. What this does is give you the best of both worlds. You get to see Traffic and New Users together with Clicks, Impressions, and a link to see the keywords that your URLs are ranking for.
On top of that, you can see traffic and new user trend graphs.
In order to use this report to improve your blog content, you’ll need to create a filter that only shows your blog posts.
If your blog content exists on a separate folder called /blog/, click the filter icon on the top right-hand side of the report and add /blog/ to the search bar.
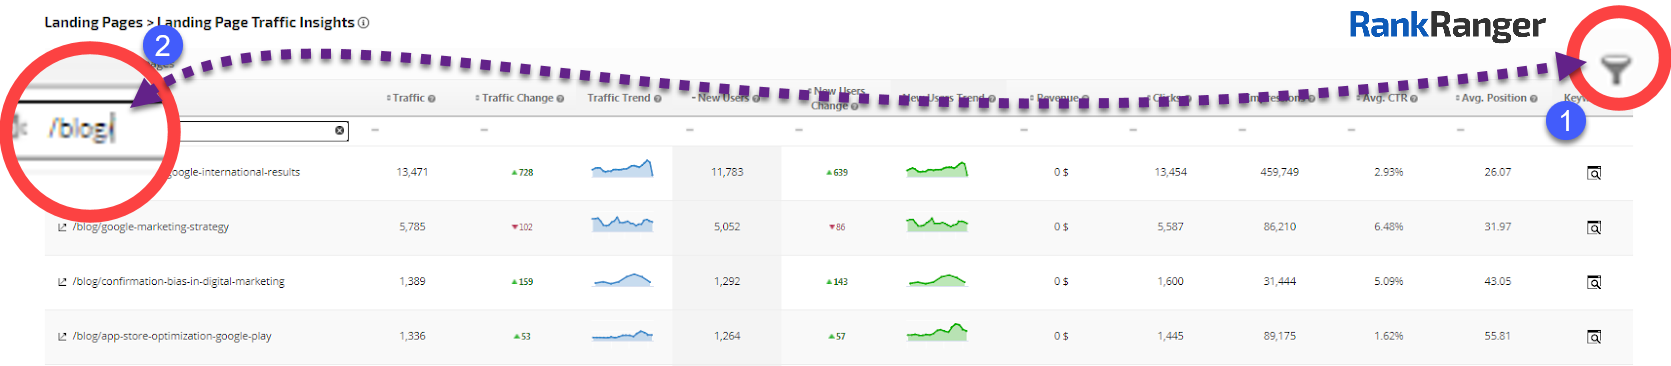
If you don’t have a separate /blog/ folder, you can always download the report and filter it in Excel.
Now that you have only blog traffic, you can look at the traffic trends.
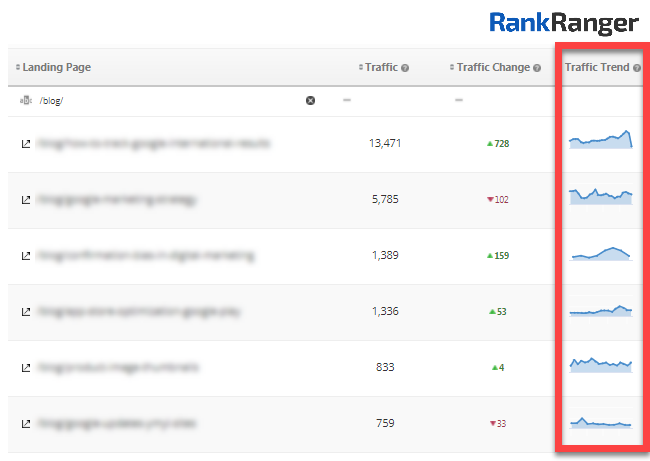
These trend graphs will show you at a glance if your pages are trending up or trending down. This will give you a good impression of which blog pages need your attention.
Once you’ve seen a page that needs attention, you can click on the Keywords button for that page and you will be brought to the Google Search Console Keywords report. This report will show you all the keywords your page is ranking on.
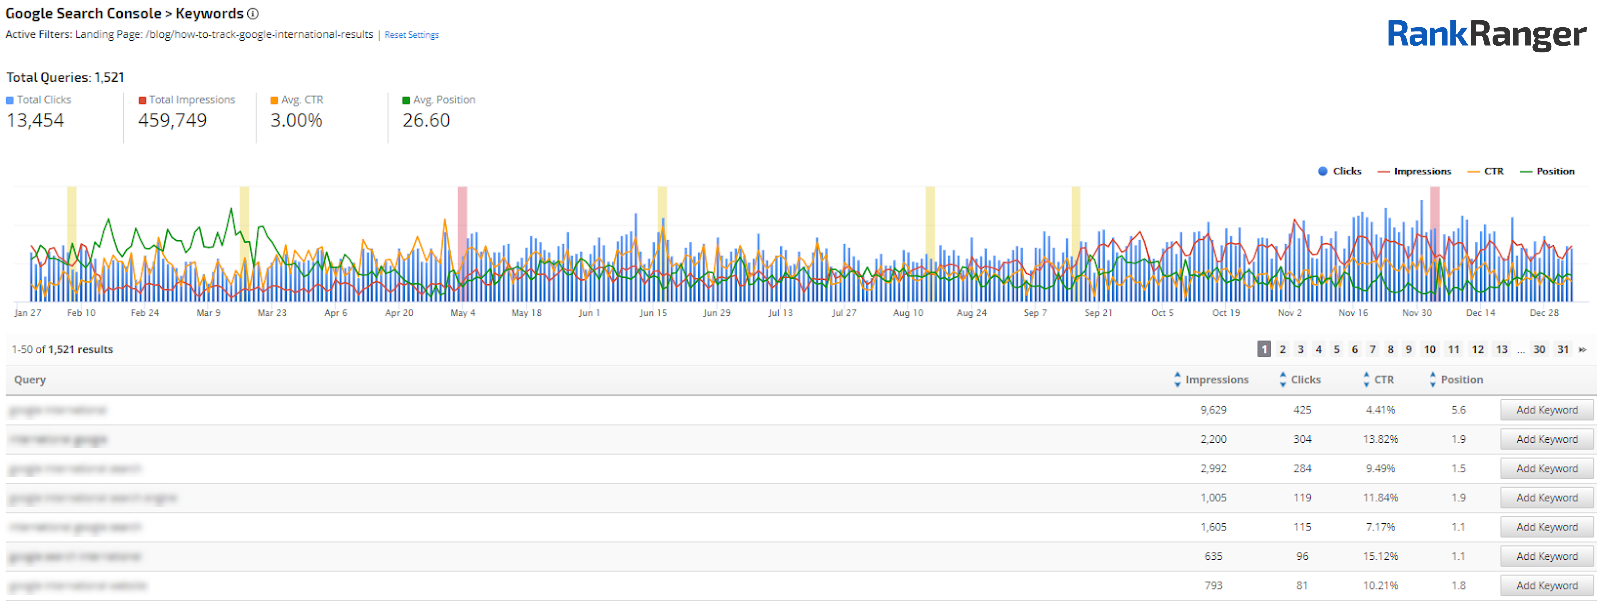
This will give you a good idea of how Google understands the content on your page. In other words, if Google is ranking your page for a keyword, Google understands that the page is relevant to that keyword. If the page is ranking at the top of Google for that keyword, Google understands that the content is not only relevant but also higher quality than other pieces of content.
This will give you a good picture of how Google relates to your content.
Not only that, this report will help you to see some opportunities to increase your rankings. To see these opportunities, click on the Position upward-pointing button and the report will arrange the data from the highest position to the lowest position.
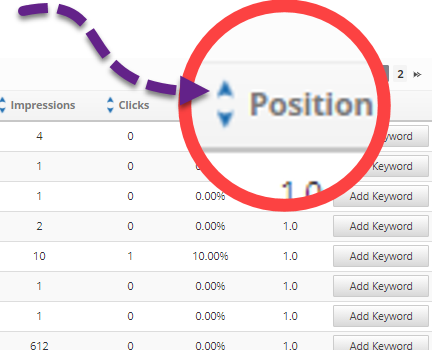
Once you’re there, scroll down to results that are between positions ten and fifteen. This will show you keywords that are sitting at the top of page two of Google. Page two content is good but isn’t quite good enough to be on page one. With an extra push, you might get your content onto page one.
To do this, try improving your content by thoroughly answering these page two search terms.
So for instance, if your page is ranking on page two for the term ‘how to bake a cake’, read through the top five organic posts. Does your content answer this question as thoroughly as the top five posts? If not, do some research and write something that is more thorough and clearer than these top five results.
Also, be sure to add images or videos where relevant. If you do this well, it’s likely that over time your page will increase its rankings.
Once you’ve done this, you can track how successful your efforts are by seeing if Google is ranking your page for new queries…
Google Search Console Gain & Loss Report
This next report is from the Rank Ranger Google Search Console reports. If you go to the Search Console Gain & Loss report, you’ll see what new searches your pages are showing up for and which searches your pages are no longer showing up for.
This data will not show you how your users are relating to your content but instead will show you how Google understands how your content answers your user’s search intent. In other words, if your content has begun to show for a new search query, Google understands that your content has become relevant to that query.
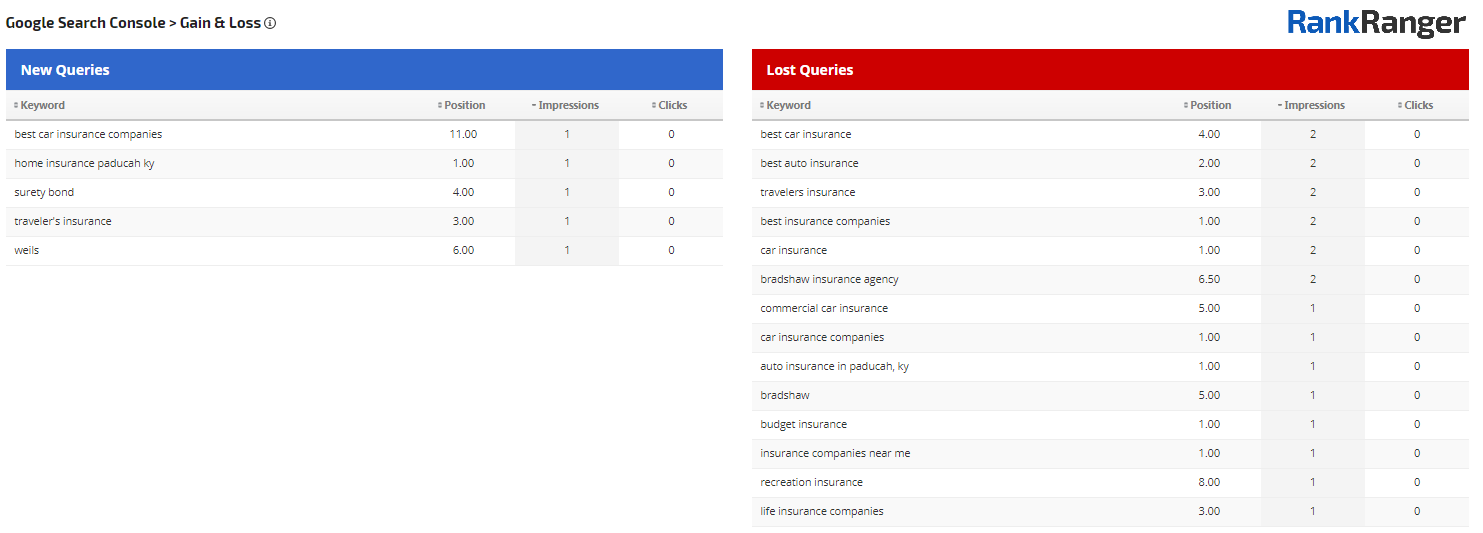
You can use this report to see if Google understands improvements you have made to your content has made it more relevant to your audience’s search intent.
In other words, if everything remains equal and you are making your page more relevant, you should see an increase in relevant search terms. If you have made your content less relevant, you should see a drop in relevant search terms.
Now before wrapping this post up, I just want to discuss Bounce Rates…
Bounce Rates – Your Best or Worst Metric?
When measuring the effectiveness of content, many marketers spend time and effort to try to lower their bounce rates.
Now in order to evaluate whether this is a good or bad idea, it’s important to know what Bounce Rates are actually measuring.
According to Google, ‘A bounce is a single-page session on your site.’ In other words, if a person lands on one of the pages on your site, and then performs no other action, it counts as a bounce.
Now think about it…
If a person bounces from a top of the funnel content piece, would you consider the bounce good or bad?
I would argue that as a measure of how successful top of the funnel content is, Bounce Rate is of no consequence. The reason is simple. A person could read each and every word of your content making notes on a notepad and if they then leave your site, it’s considered a bounce.
From the perspective of how engaging and useful your content is, Bounce Rate pretty much says nothing.
This means Bounce Rate is not a useful metric in understanding the quality of your content. (On the other hand, it can indicate whether your content is pushing your audience to engage further and eventually move down your sales funnel, but as I have mentioned above you can already see this by looking at the Average Pages Per Session.)
Now, having seen all of these metrics, let’s step back and look at the big picture…
The Key Takeaway is…
Since blogging as a way to drive sales is complex, it requires that you keep your eye on a list of metrics. Hopefully, this post has given you some clarity as to what you should be looking at. What’s more, hopefully, I have demystified Google Analytics a bit, making the data a little more accessible.
In other words, to understand how successful your content is, you need to take the time to think about:
- What is your best and worst-performing content?
- How your audience is engaging with your content
- If your audience is moving down the funnel or are they dropping off
These insights are the first step in improving your content and increasing sales. Take this data as a benchmark and see how your metrics change over time. If you see improvement, you know you are on track.
About The Author