Posted by
Shay Harel
Offering a SERP bounty of sneak peeks, surprises, and all around SERP treats, this Snapshot is not one to miss! While the SERP offered some interesting surprises, the SERP Features tool was reloaded to track new and powerful data. Dilly-dallying no further let’s hop to it and get into the data (and closer to our sneak peek).
Featured Snippets: A Whole New Level
Over the past few weeks I’ve been discussing the rising levels of an ever-increasingly popular SERP feature, Featured Snippets. As I’ve mentioned the feature is on the rise in multiple countries and has taken on a new data trajectory. Well, now this new push for the feature has crossed the line, the 5% line that is. Showing at heights I’ve never seen for the feature, Featured Snippets in the USA crossed over the 5% line and as of June 11 appeared within 5.29% of page one results. (For a refresher on all the SERP features check out our Visual Guide to Google SERP features).
Featured Snippet Data High
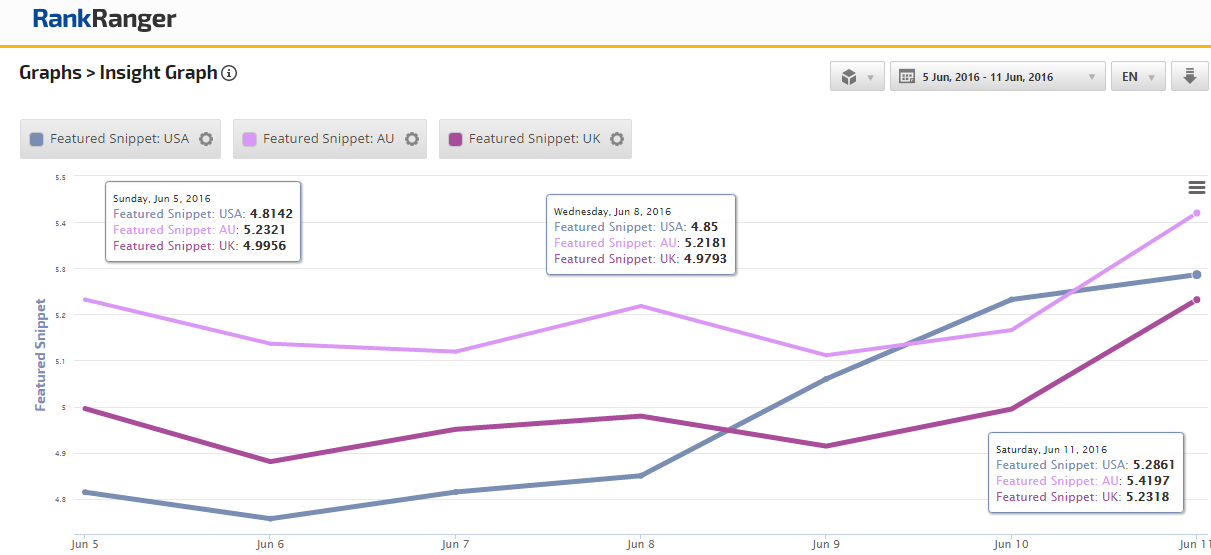
Fig 1. Featured Snippets gradually rise to display in over 5% of page one results in the USA, AU, and UK
As the USA hit the 5% mark, the countries we monitored over the past few weeks, namely Australia and the UK, also broke the 5% threshold as well. Following a similar data pattern, Featured Snippets in the UK and Australia went on the upswing on June 9 (after a short downtrend) and finished the week at 5.23% and 5.42% respectively. All in all, it would appear that my analysis from previous weeks holds true with the appearance of this SERP Feature breaking on through to the other side!
Ads on the Move
For the second week in a row Ads in the USA have been on the move as last week they continued to rise and fall successively. What’s more is that the peaks and valleys have not been as subtle as we have become accustomed to when speaking of Ads in the USA.
Ads Performance in the USA and UK
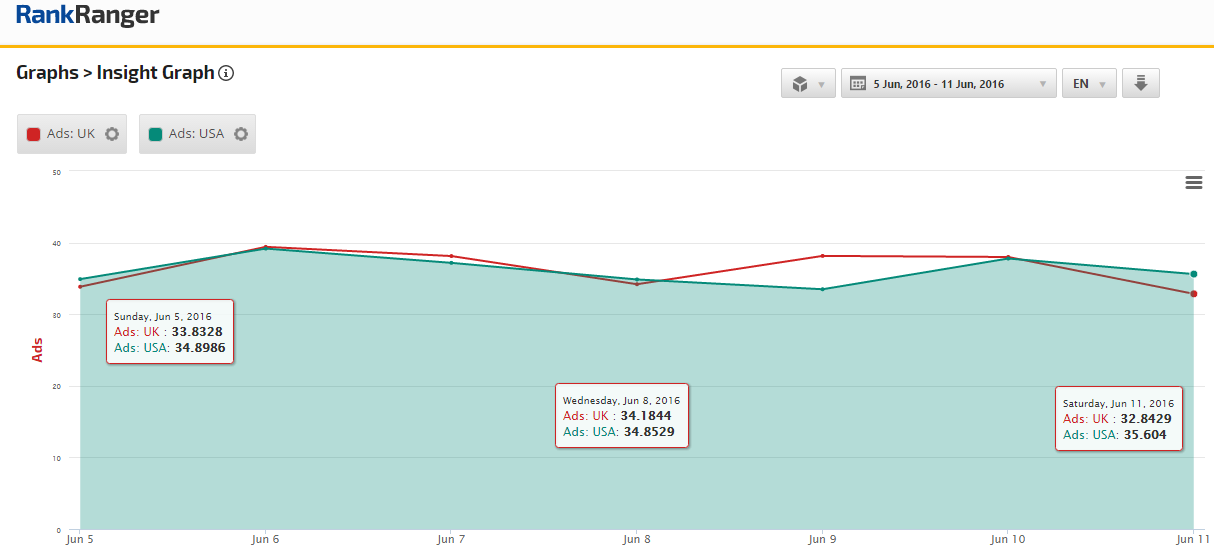
Fig 2. Ads in the USA follow a similar data path as Ads in the UK at the start of last week, taking an inverted data position towards week’s end
When compared with how Ads performed in the UK, the data out of the USA doesn’t seem odd at all. Both countries began the week at similar percentage levels. Both spiked between the 5th and the 6th, with Ads in the USA showing at 39.17%, while Ads in the UK showed within 39.41% of searches, an over 4% shift for both locations.
In fact, large spikes and downtrends of 6% or more are commonplace on the UK SERP.
Ad Behavior in the USA
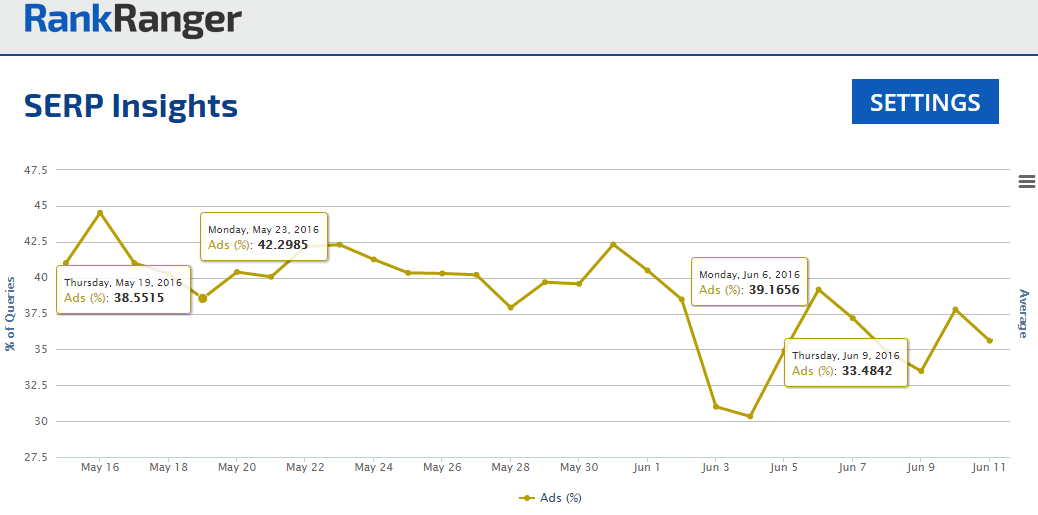
Fig 3. Ads in the USA show increased volatility as June progresses
While volatile Ad percentages are the norm in the UK, they are not common in the USA. Between June 6 and June 9, Ads in the USA fell nearly 6%. If you look at the data plotted via the SERP Features tool (Figure 3), you’ll notice that drastic shifts like that are not common when looking back at an extended data history. A shift of approximately 4% (see May 19 – May 23) is as “shifty” as Ads in the USA have behaved in the more recent past. However, since May 31, Ads in the USA have taken on more dramatic data changes, changes that only continued last week. It will be interesting to see if this sort of up and down behavior continues as time goes on. Not to worry, I’ll keep my eye on it!
Related Questions’ Relative Rise
One of the most dramatic shifts on the SERP last week had to have been the performance of Related Questions. With a mighty significant spike throughout the English speaking world, Related Questions took a mid-week data shift.
Related Questions’ Mid-Week Data Shift
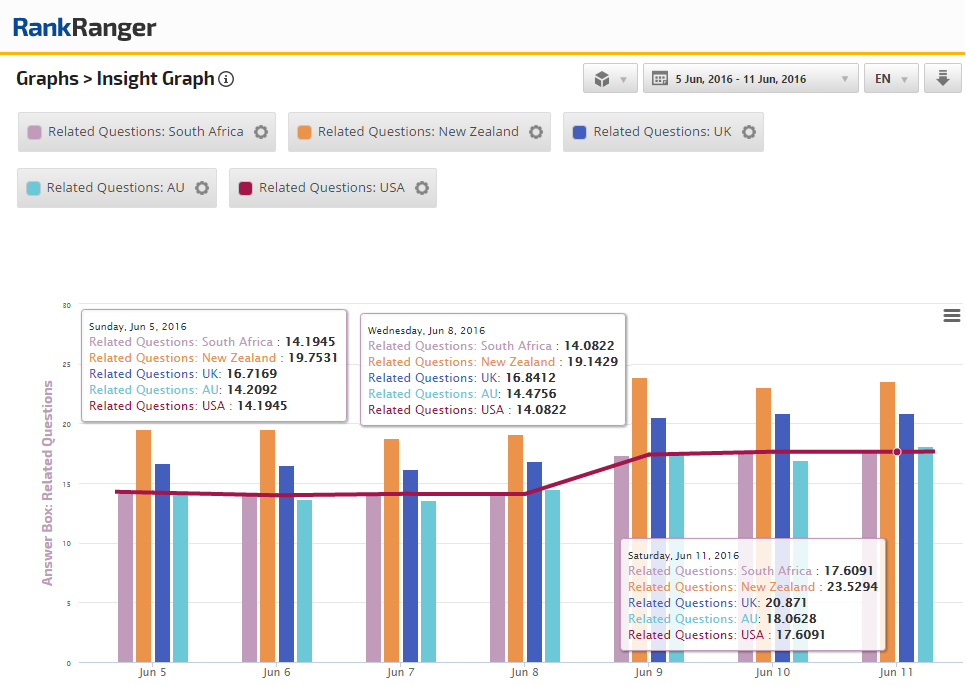
Fig 4. Related Questions spike between June 8 – 9 throughout the English speaking world
The similarities between the displayed countries is the real news. Firstly, all of the countries display Related Questions within a similar data range, between 15% – 20% of page one results. Secondly, the countries all underwent a spike between the 8th and 9th. Lastly, the increase the feature took on was again within the same range for all countries.
Specifically, South Africa saw a weekly increase of about 3.42%, while New Zealand showed a 3.78% rise. In the UK there was a weekly increase of 4.15% in Related Questions, with Australia displaying a slightly lower increase of roughly 3.85%. Lastly, the USA showed a weekly increase of 3.42%, again within a similar range to the above-listed countries.
It is interesting to note that Related Questions is of a similar nature to Featured Snippets in that they present information found within webpages (with a Featured Snippet showing information from a result listed on that specific page). When viewed in aggregate, it seems as though Google may be consciously working to feature answers on the SERP via website content (as opposed to Google offering the information on their own).
Mobile Rank Risk Spike (and a Sneak Peek Into a New Tool)
While the Rank Risk Index was quiet on desktop, its mobile counterpart was anything but. Last week saw higher than normal risk levels for five out seven days.
Mobile Fluctuations on the Rank Risk Index
![]()
Fig 5. Rank risk levels on mobile show a trend of moderately high levels
Compared to the relatively cool levels shown as of mid May, the mobile risk levels since June 3 have been relatively high. In fact, last week we saw continued heat that culminated in a risk level of 66 on June 11.
With what’s causing this rise being the pertinent question allow me to allow you a glimpse behind the curtain of our mobile SERP features tracking. If you have been following Rank Ranger on Twitter you may have noticed that we’ve been posting some data surrounding AMP’s performance on mobile, among some other mobile features. That’s because we have been working on mobile SERP tracking to compliment the data we report on desktop. So without further adieu here is a sneak peak at some of the data soon to be rolled-out.
Mobile SERP Features Data Spike
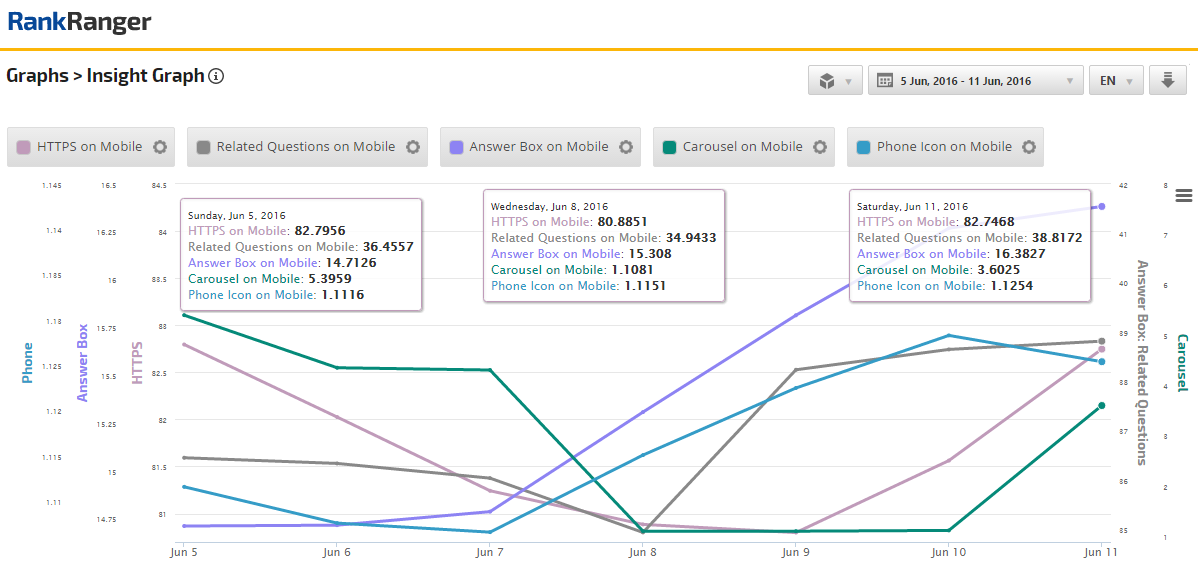
Fig 6. Various SERP Features show a data rise as risk levels display at higher than average levels on the Rank Risk Index
When looking at SERP Feature performance on mobile I found a multitude of features that took notable shifts in conjunction with the raised risk levels. HTTPS on mobile had an odd week as it saw an approximate decrease of 2% between June 5 – June 9 (before jumping back up roughly 2% by week’s end). This is odd for a feature that generally climbs only upward moderately each week.
Related Questions on mobile, like its desktop counterpart, rose about 4% between June 8 – June 11, while Answer Box saw only a moderate increase (though significant as the feature has never shown this high on mobile before). Continuing this trend of features on mobile showing at unseen levels was Phone Icon. Though the feature does not display mammoth numbers, it did rise relatively sharply between June 7 – June 10. By week’s end the feature was showing at levels we have not seen for it since we began recording mobile SERP Features data (which has been for a while at this point).
Also showing at unprecedented levels was Carousel on mobile. The feature began the week at elevated heights, appearing within 5.39% of page one results. The feature went “topsy-turvey” falling over 4% between June 5 and June 8. Though, the feature did rise slightly by the end of the week.
Actually, if we look at the average number of Carousels on page one, we see some very telling data. Our unreleased tracker is showing an over 200% increase in the average number of Carousels appearing in the USA.
Carousel: Average Per Page Data
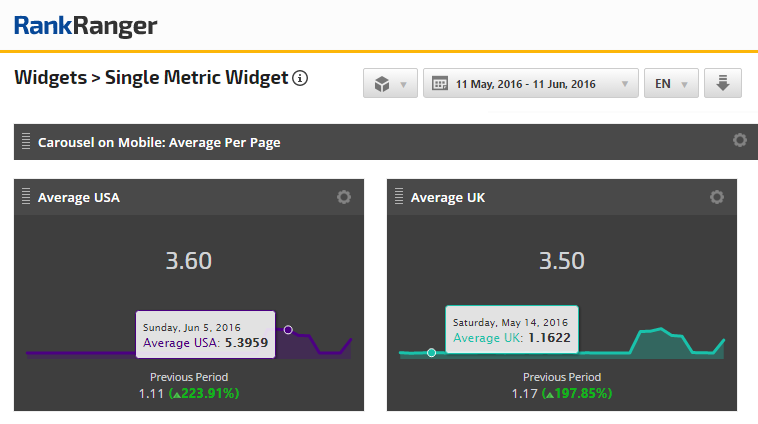
Fig. 7. The average number of Carousels per page in the USA and UK skyrocket
The newly released Single Metric Widgets show us just how sharply the number of Carousels per page have risen. Prior to June an average of just over one Carousel was appearing on the SERP. All that has changed and as of June 11 we are seeing an average of 3.6 Carousels in the US and 3.5 in the UK.
The only other theory I can present behind the high mobile rank risk levels is related to May’s mobile algorithm update. It is possible that after a month of collecting data on its new algorithm update, Google has began to tweak things on mobile accordingly.
The SERP Features Tool: Stacked to the Max
While I hope seeing the above mobile SERP data has whet your appetite for the full-on release of the Mobile SERP Features tool, I feel bad teasing you like that. As a means of compensation, let me present to you the new data now being tracked by the SERP Features tool on desktop.
Title and Description Length
First and Foremost, the SERP Features tool now tracks the average length of both result titles and descriptions. With all of the tests to the SERP layout that have impacted the length of the search column, this information is ever in need.
Results Description Length: Google USA
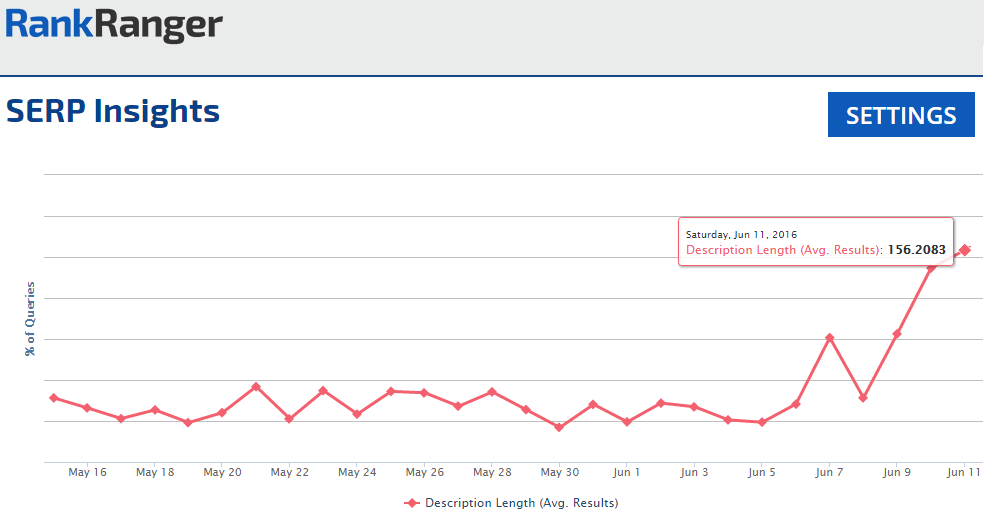
Fig 8. The average length of result descriptions on Google USA
Further, this information can be broken down and ordered globally. In other words, you can track the average length of result titles and descriptions globally and in sequence.
Global Search Column Length Data

Fig 9. Average title length of results by country in order of longest to shortest average title length
Home Page and Landing Page SERP Ratios
For my last trick, Home Page vs. Landing Page percentages. Did you ever wonder just how many Home Pages vs. Landing Pages Google is displaying on the SERP? Well now you know! The SERP Features tool is now equipped to track the percentage of both types of pages on the SERP.
Home Page and Landing Page Ratio in the UK
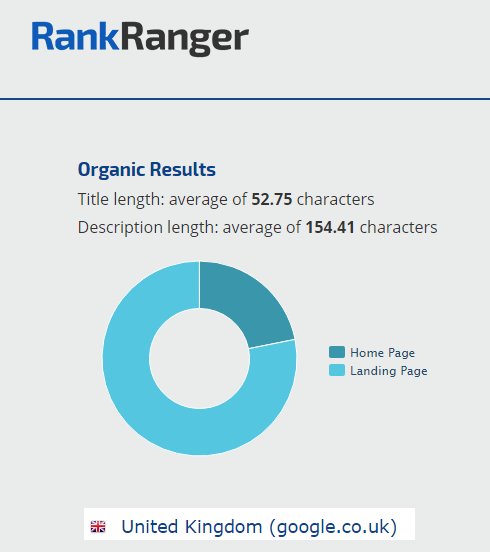
Fig 10. A pie chart showing the ratio of Home and Landing Pages in the UK
Here too, the tool allows you to see the data by country and in sequential order, thereby providing you with the information to track trends globally with ease.
SERP Overload
Are you feeling overwhelmed with SERP newness? How do you plan to employ the new data being tracked on the SERP Features tool?
How excited are you to see the full roll-out of mobile SERP data?
Will Featured Snippets and Related Questions continue to reach new heights?
Will Ads in the USA calm themselves and return to previous tranquility?
As always, share away!
About The Author